Star Wars: The Last Jedi will earn $220 million at the domestic box office this weekend, according to Disney’s Sunday morning estimate. After starting out with the second-biggest day of all time on Friday (a monstrous $104.787 million, including $45 million in Thursday previews), the film looks to be holding on well through the weekend. Saturday’s estimate is $64 million, off 39% from Friday, compared to The Force Awakens’ decline of 43% on its second day. Disney is projecting a decline of 20% on Sunday, while Awakens dropped 11%, which suggests caution on their part, and the possibility of a final opening weekend a little higher than their current projection.
More...
December 16th, 2017

The Last Jedi topped last night’s estimate, earning $104.78 million on Friday. It is only the second film to reach the century mark during its opening day. It is still 12% lower than the $119 million The Force Awakens opened with, but if it has the same legs, it will earn $218 million during its opening weekend. The reviews are practically identical and both films earned an A from CinemaScore, so having similar legs is more likely. Sequels usually have shorter legs, but The Last Jedi had better growth from Thursday previews to Friday’s numbers, so this could be a good omen. Maybe it will earn $220 million during its opening weekend.
More...
December 15th, 2017

Disney is really on top of the The Last Jedi hype train sending updated tracking of its opening day. Instead of aiming for $94 million to $99 million, the studio is aiming for $99 million to $104 million, putting on pace to be only the second film to earn $100 million during its opening day. Furthermore, CinemaScore released their final rating and it was a solid A, exactly what the reviews would suggest. The studio expects the film to make $205 million to $215 million over the weekend, which is close enough to our prediction that I’m happy.
More...
December 15th, 2017

Disney just sent out updated tracking for The Last Jedi’s opening Friday. The studio expects the film to earn in the mid- to high-$90 million range, which puts it on pace for approximately $200 million. If the film doesn’t get to $200 million over the weekend, then it will be more front-loaded than we anticipated and more front-loaded than the reviews would suggest. We will keep you posted as more numbers come in.
More...
December 15th, 2017

Star Wars: The Last Jedi opened in another 34 markets on Thursday, helping it reach $60.8 million internationally after just two days of release. At the same point in its run, The Force Awakens had $72.7 million, while Rogue One had $37 million. The Last Jedi is slightly closer to the high end rather than the low end, but not by enough that we need to adjust our prediction.
More...
December 15th, 2017

We expect Star Wars: The Last Jedi to have an opening weekend box office total almost exactly in the middle of The Force Awakens and Rogue One. Since those two films earned $57 million and $29 million respectively during their previews, The Last Jedi would need $43 million to be on target. According to Disney it pulled in $45 million last night, making it the second-best Thursday preview of all time. (The Force Awakens is number one, while Harry Potter and the Deathly Hallows, Part II was pushed into third place with $43.5 million.) That’s not a lot above where we needed it, but does make $210 million for the weekend more likely. Additionally, the reviews remain impressive at 93% positive, while the average score given by the critics so far is 8.2 out of 10. There were some grumblings that the audiences were less impressed; however, this appears to be internet buzz and not reflective of the real world. We don’t have the full ComScore grade yet, but they reported 90% positive results last night, as well as 82% in the “Definitely recommend” category. That’s simply fantastic. We will have a better picture by this time tomorrow when the Friday estimates arrive and we can compare legs with the previous two Star Wars films.
More...
December 14th, 2017

As I predicted last week, the final theater count for The Last Jedi is about 100 more than Disney’s original projection. The latest from the Star Wars franchise will play in 4,232 theaters on Friday, 78 more than screened The Force Awakens two years ago.
More...
December 14th, 2017

2017 is behind 2016’s pace by over $400 million and and this weekend is the last chance it has to cut that deficit by any real margin. This weekend, Star Wars: The Last Jedi debuts and it is practically a guaranteed monster hit. Rogue One made just over $400 million in the 2016 calendar year, while The Force Awakens earned just over $650 million. The Last Jedi is widely expected to earn somewhere in-between those results. In the meantime, there is one other wide release, Ferdinand, which is the textbook definition of counter-programming. The studio is just hoping it doesn’t get lost in the crowd. This weekend last year, the total box office was $211.57 million. I give The Last Jedi about a 50/50 chance of topping that by itself.
More...
December 12th, 2017

First a quick note, this is a weekend preview, not weekend predictions, because I’m looking more at the big picture and less at the actual weekend numbers. Star Wars: The Last Jedi opens this weekend, although if you are part of our international readership, it might have already opened where you live. We will be going over its daily results as soon as they start coming in. In the meantime, I’m a little more bullish than I was last week, as the reviews finally started coming in. The film’s Tomatometer Score is an impressive 93% positive with an average score of 8.3 out of 10. This is actually on par with or better than some Awards Season players and it is stellar for a blockbuster. The film is widely expected to fit somewhere between The Force Awakens and Rogue One and with a lot of people saying this is the best Star Wars film since The Empire Strikes Back, the higher end appears to be more likely than the lower end. Previously, $200 million was the target for the film’s opening weekend, but now $210 million to $225 million is within reach. Furthermore, it is expected to top that during its opening weekend internationally leaving the film with a slim chance at $500 million worldwide. On the downside, the film likely cost that much to make and advertise, so it needs to be a $1 billion hit worldwide to break even in a timely fashion. Fortunately, no one really thinks that will be a problem. In fact, a lot of people are assuming the film will earn $1 billion internationally, while most won't be shocked if it reaches $2 billion worldwide.
More...
December 1st, 2017
The box office was mostly as expected during November. Granted, Thor: Ragnarok over-performed and Justice League underperformed, but overall there were no real surprises. This means the month started slow, but we got a couple of wins in the end and that bodes well going into the final month of the year. That said, December is a weird month. There are five weekends, but only seven films that I’m sure are opening truly wide. Additionally, five of those seven films are opening Christmas weekend. I’ve never seen a month this lop-sided. There are no real wide releases the first two weeks of the month, so we will likely start slow again, but when The Last Jedi debuts, we should see explosive growth at the box office. It will open with more than any film last December made and that should help 2017 cut into 2016’s lead. 2017 won’t be able to close the gap entirely, but the month could do well enough to cut 2016’s lead to under $250 million. That’s my goal. If that happens, I will be happy.
More...
August 24th, 2017
-1-News.jpg)
Here at The Numbers, we strive to improve your reading experience by adding more features we believe you will find interesting. Today, the new feature is top single-market hits. As the chart shows, the biggest single-market hit is Star Wars: The Force Awakens, which earned $936.66 million in North American. The top of the chart is still dominated by releases in the United States, and second place used to belong to Avatar. But this week, Wolf Warriors 2’s Chinese box office topped that figure and it currently has $783.02 million. This is game changing … although we’ll have to see how it plays out.
More...
April 3rd, 2017

This is a terrible week on the home market, mostly. Rogue One: A Star Wars Story comes out on DVD or Blu-ray Combo Pack and the competition has clearly scared away any other top-level releases. The only other first-run release is Office Christmas Party, which is worth a rental, if you like anti-Christmas movies. As far as Pick of the Week contenders are concerned, there’s Rogue One... and really that’s it. There are a couple of other releases I highlighted, but they wouldn't be contenders during an average week. Don’t Kill It looks good for a low-budget horror movie, while Paterson is coming out on a featureless DVD / Blu-ray. They are worth picking up if you are a fan of their respective genres.
More...
March 29th, 2017

It’s a good week for Pick of the Week contenders, as there are seven such releases on this week’s list. Unfortunately, none of them really scream out as The Pick of the Week. Rogue One: A Star Wars Story is by far the biggest, but it is only out on Video on Demand right now, while Hidden Figures is the best, but again, it is only on VOD this week. There are also a couple of busted Oscar-bait films, Archer: Season Seven is only getting a DVD release, while the previous seasons came out on Blu-ray. In the end, I went with Mystery Science Theater 3000: Volume XXXVIII, partially to celebrate the return of the show.
More...
March 27th, 2017

Rogue One: A Star Wars Story is the first in a series of standalone movies movies Disney is planning for the Star Wars franchise. There were some who questioned whether or not audiences would show up to a Star Wars movie if it wasn’t directly part of the overall story. Turns out the answer to that question is yes, to the tune of over $1 billion worldwide. This was nearly 50% less than The Force Awakens earned, but is it also much weaker in terms of quality?
More...
December 18th, 2016

Rogue One: A Star Wars Story is set for the second-biggest weekend in December, third-biggest weekend of 2016, and twelfth-biggest weekend of all time, with Disney predicting a weekend of $155 million, as of Sunday morning. Needless to say, that’s a great result for the Star Wars spin-off, beating the studio’s pre-release guidance, and hitting or exceeding the numbers that most in the industry were expecting. Our model predicted $151 million as of yesterday morning, so the film is maintaining its momentum through the weekend, and there are some reasons to believe that Rogue One may beat Disney’s Sunday projection.
More...
December 15th, 2016

Finding tickets might be a challenge in some cases, but finding a theater that’s playing Rogue One: A Star Wars Story this weekend won’t be hard, with Disney announcing early this afternoon that the Star Wars spin-off will debut in 4,157 theaters, just a shade more than the 4,134-theater opening that helped The Force Awakens to all those box office records this time last year. Rogue One isn’t expected to hit those heights—our weekend prediction is $143 million—but it will certainly be the second-biggest opener in December. Its target on the all-time best openings in December chart is the $149 million earned by Episode VII in its second weekend. Anything more than that would be outstanding, even by this franchise’s impossibly high standards.
More...
December 15th, 2016

It is a deceptively busy weekend, as there are two wide releases, Rogue One: A Star Wars Story and Collateral Beauty, and two films that are “expanding wide”, Manchester by the Sea and La La Land. However, while that looks like a lot, in reality Rogue One: A Star Wars Story is the only film most people are talking about. In fact, it is going to dominate the box office to such a degree that its only real competition is The Force Awakens, which opened this weekend last year. Unfortunately for Rogue One, there’s almost no chance it will match The Force Awakens. In fact, there’s almost no chance the entire box office will match the $247.97 million The Force Awakens opened with. 2016 is going to get crushed in the year-over-year comparison. That said, 2016 has a nearly $460 million lead over 2015, so has long as Rogue One tops $100 million over the weekend, it should be enough to keep 2016 ahead in terms of raw box office numbers.
More...
August 29th, 2016

We are in the heart of TV on DVD season with a dozen such releases on this week’s list. Unfortunately, while there are a few that are worth picking up, none of them have the extras needed to be Pick of the Week contenders. The biggest release of the week is The Jungle Book, which is one of the biggest hits of the year. I got a chance to review it, so you can compare my opinion to the critics. As for the best of the best, there weren’t a lot to choose from. In the end, I went with The Commitments, which is making its Blu-ray debut this week.
More...
August 7th, 2016

One of the most talked-about debuts of the year is shaping up to be one of the better ones. Suicide Squad will open with about $135 million, according to Warner Bros., easily the biggest weekend in August, beating Guardians of the Galaxy’s $94.3 million in 2014. It’s also the 3rd-best weekend in 2016, and should earn a little more than Deadpool’s $132 million debut. In spite of these awesome stats, there’s about as much negative press for the film as positive, and some of it not entirely fair.
More...
July 24th, 2016
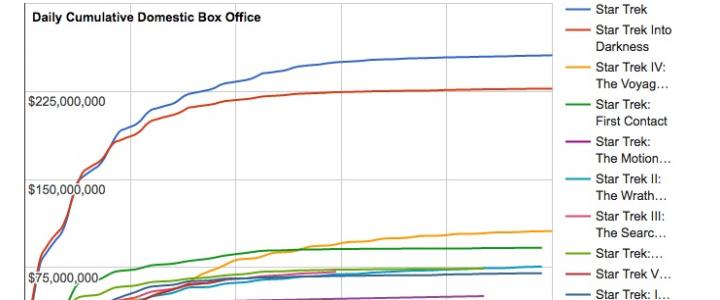
Star Trek Beyond will fall just short of $60 million at the box office this weekend, according to Sunday estimates from Paramount. The studio has the film coming in at $59.6 million over three days, which is substantially short of the $79.2 million earned on debut by Star Trek (the reboot) in 2009, and the $70.2 million made by Star Trek Into Darkness. The so-so start comes in spite of excellent reviews, which are now running at 84% on Rotten Tomatoes, and the franchise seems to have trouble reaching beyond its core audience.
More...
April 4th, 2016

After ranking Star Wars: The Force Awakens for those who still haven't seen it, we can do a full featured review. The film smashed box office records here and earned 92% positive reviews. Is it as good as its box office / Tomatometer Score? Or did people just get caught up in the hype?
More...
April 3rd, 2016

Despite what the box office numbers would indicate, there are some people who have never seen Star Wars: The Force Awakens. [Copy Ed: Some of us have never seen any Star Wars movie]. Because of that, we are going to have two reviews. The first is going to contain absolutely no spoilers... okay, just one spoiler. The big boat sinks in the end. ... On the one hand, I feel the need to apologize for that joke. On the other hand, I will never not find that joke funny. So how do you do a review without a single spoiler? Simple, nothing but lists. I will rank The Force Awakens in a trio of lists. How does this film compare to others in the Star Wars Franchise? How does it compare to the biggest hits of 2015? And finally, how does it compare to the biggest all-time hits?
More...
March 1st, 2016

It's March 1st, which is not only the beginning of the month, but also Super Tuesday. If you are not American and don't pay attention to American politics, Super Tuesday is sort of like the Oscar night of the primary season. I was going to write about my predictions, but it looks like the race is about to be over. On the Republicans side, if Trump gets more than 50% of the delegates, then he has won. It will be too late to stop him. If he gets less than 40%, then it becomes a real race again. If the polling is correct, then he will get closer to 50% than 40%. On the Democratic side, Sanders needs at least 45% of the delegates, or it is over for him. Anything less than that and Hillary Clinton will have too big a lead to overcome. If the South Carolina result is an indicator, Hillary Clinton could get two-thirds of the delegates awarded tonight.
As for the box office, February was amazing, thanks to Deadpool's record-breaking opening and better than expected legs. The month ended with 2016 being nearly 4% higher than 2015's pace. Additionally, there are some big releases coming out this month with both Zootopia and Batman v Superman: Dawn of Justice looking to get more than $200 million, while Allegiant should hit $100 million. Last March, there were also three films that earned more than $100 million, but only one $200 million hit, Cinderella. It should be a really close race between 2016 and 2015.
More...
February 8th, 2016
-1-News.jpg)
Super Bowl weekend was not a good weekend at the box office. The competition usually takes its toll at the box office, but this year it was particularly bad. Kung Fu Panda 3 led the way with just $21.24 million, while Hail, Caesar! was the only other film to earn more than $10 million. In fact, the weekend was so bad that Star Wars: The Force Awakens remained in third place during its eighth weekend of release. The overall box office took a massive hit, down 31% to just $95 million. This was 37% lower than the same weekend last year, but miraculously, 2016 maintained its lead over 2015, by the tiniest of margins, $1.34 billion to $1.33 billion. With a difference of 0.5% or $6 million, the lead will likely disappear during the week, but 2016 should get it back when Deadpool debuts this Friday.
More...
January 14th, 2016

Star Wars: The Force Awakens will finally relinquish its hold on the weekend box office and there are three new releases looking to grab as much of the box office share as they can. Ride Along 2 is the film with the best shot at first place, assuming its reviews don't kill it. The Revenant should have one of the best week-to-week declines, thanks in part to its Awards Season success. 13 Hours looks like a solid top-five film, but not a major hit, while Norm of the North is just hoping not to embarrass itself. This weekend last year, American Sniper expanded wide and set the record for biggest January weekend. That record fell earlier this year, but that's not a lot of comfort for this weekend, as all three new releases combined won't match American Sniper's haul. 2016's winning streak will end at two weeks. Hopefully the upcoming losing streak won't be much longer than that.
More...
January 12th, 2016

Star Wars: The Force Awakens earned first place on the weekend chart for the fourth time and likely the last time. It was a close race, as The Revenant beat expectations; meanwhile, The Forest was very solid as counter-programming. The overall box office was $159 million, which is 28% less than last weekend, but 26% more than the same weekend last year. After just two weeks, 2016 is 19% / $70 million above 2015's pace. Granted, it is way too early to make any long terms predictions and next weekend will be brutal for 2016 in the year-over-year comparison, but every little bit now will help at the end of the year.
More...
January 6th, 2016

We don't have the final Wednesday numbers, but it was announced that Star Wars: The Force Awakens has overtaken Avatar to become the All-Time Domestic Box Office Champ. This is far from the end for the film, as it is poised to reach $800 million over the weekend and it has $900 million domestically within its sights. The film hasn't entered the top ten on the All-Time International Box Office, but will continue to climb that chart as well. So while the number of stories we do for The Force Awakens will slow down, there's still plenty of newsworthy events ahead. And of course, we will track its daily numbers on the box office section of the site until it is out of theaters entirely.
More...
January 6th, 2016

It's an odd week on the international box office chart, as Star Wars: The Force Awakens is the only Hollywood film in the top five. The latest Star Wars instalment earned $96.3 million over the weekend for an international total of $770.5 million. Its Worldwide total rose to $1.513 billion. At the end of business on Sunday, the film was in third place for the year on the worldwide chart, but that has since changed. It is also in fifth place on the yearly international chart. However, the film opens in China this week and it could jump into third place just due to its opening in that territory.
More...
January 5th, 2016
Before Star Wars: The Force Awakens came out there had only been one film to reach the $750 million milestone. That film was Avatar, and it took the film 253 days, and a late summer re-release, to get there. The Force Awakens reached the milestone in just 18 days. The latest Star Wars installment earned $8.02 million on Monday for a running tally of $750.23 million. Avatar finished with $760.51 million, a figure The Force Awakens will top in two days, at the most. Meanwhile, it should have no problem becoming the first film to ever hit $800 million domestically and will do so over the weekend.
More...
January 4th, 2016
As expected, Star Wars: The Force Awakens dominated the weekend box office earning $90.24 million, breaking several records along the way. However, it did fall 40% over the weekend, which is a lot for this time of year. It appears The Force Awakens is acting more like a typical blockbuster hit and less like the typically leggy December release. That said, I don't think Disney is disappointed with the results so far. On the other hand, The Hateful Eight got off to a disappointing start earning third place with just a fraction of Django Unchained's opening weekend. The overall box office was down from last week, but was still an incredible $219 million. This was 26% lower than last week, but 41% higher than the same weekend last year. Year-to-date is a little less useful, as 2016 is only 3 days old, but it is 27% higher than 2015 was after the first weekend. This is even more impressive, as 2015 had an extra day before the weekend.
More...
January 3rd, 2016
 This weekend sees the first signs of a slow-down at the box office for The Force Awakens, which will be down 41% from last weekend, according to Disney’s Sunday morning estimate. That’s the worst comparative performance in the top ten, and much weaker than Avatar’s 9% decline the same weekend in 2010. Such statistics are fairly academic when you already have $700 million in the bank domestically, though, and Star Wars’ momentum coming out of the holidays is such that it will register the biggest ever New Year’s weekend, and the biggest-ever 3rd weekend, overtaking Avatar’s $68.5 million. With $770.5 million overseas so far, its global total is now over $1.5 billion, putting it in the top six all time, and guaranteeing it will end in the top three, with only Titanic and Avatar left to shoot for.
More...
This weekend sees the first signs of a slow-down at the box office for The Force Awakens, which will be down 41% from last weekend, according to Disney’s Sunday morning estimate. That’s the worst comparative performance in the top ten, and much weaker than Avatar’s 9% decline the same weekend in 2010. Such statistics are fairly academic when you already have $700 million in the bank domestically, though, and Star Wars’ momentum coming out of the holidays is such that it will register the biggest ever New Year’s weekend, and the biggest-ever 3rd weekend, overtaking Avatar’s $68.5 million. With $770.5 million overseas so far, its global total is now over $1.5 billion, putting it in the top six all time, and guaranteeing it will end in the top three, with only Titanic and Avatar left to shoot for.
More...
January 2nd, 2016

It took just 15 days for Star Wars: The Force Awakens to overtake Jurassic World’s final domestic box office. On Friday, the film earned an easy first place with $34.46 million to push its running tally to $686.43 million. Not only is this the best domestic box office for a film released in 2015, it is more than enough to overtake Titanic and push it into second place All-Time. As for the film’s weekend projection, we are looking at a $95 million weekend, plus or minus $5 million. It is possible the film could crack $100 million over the weekend, but very unlikely. That said, it has already broken a couple of major records—Fastest to $650 million and Biggest Domestic Hit of 2015—and will likely break a few more over the weekend (Fastest to $700 million, Biggest third weekend, and Biggest January weekend).
More...
December 31st, 2015
There are two questions that are being asked about this weekend. Firstly, will Star Wars: The Force Awakens become the first film to earn $100 million three weekends in a row? Secondly, will The Hateful Eight live up to Django Unchained? I'm going to say no to both, but the former is much more likely than the latter. The rest of the top five should look the same as last time, with Daddy's Home being the best of the holdovers. The Force Awakens should earn more than the top five did last year, giving 2016 a fast start on the year-over-year comparison.
One last note, there are only two limited releases this week, including Anomalisa, which we previously talked about. The only other limited release is Devil and Angel, which has no reviews, so there's not much to talk about. Because of this, there will be no Limited Release Report this week.
More...
December 30th, 2015

Two surprising events happened today. Firstly, it was announced that Star Wars: The Force Awakens topped $600 million at the domestic box office yesterday. I wasn't expecting that to happen. I thought it would miss the $600 million mark and cross that milestone today. Secondly, I was surprised that The Force Awakens could still surprise me after every record it has broken so far. The film pulled in $29.53 million on Tuesday lifting its running tally to $600.95 million after just 12 days of release. The previous record for Fastest to $600 million was set by Jurassic World earlier this year at 36 days. Jurassic World shaved 11 days off the previous record, set by Avatar in 2009, and that was considered an amazing feat. Getting to $600 million three times faster than the previous record is mind-blowing.
More...
December 30th, 2015
Star Wars: The Force Awakens remained on top of the international chart with $133.3 million for a total of $546.0 million after just two weeks of release. Worldwide, the film already has $1.086 billion, putting it in the top 20 all-time after just two weeks of release, although it is still in fifth place for the year. It has been an amazing year on the top. It reached the $1 billion mark in just 12 days, beating Jurassic World's previous record by just one day. Granted, Jurassic World had China to boost its sales. The U.K. remains the film's biggest market with $98.07 million after two weeks of release, including $15.13 million this past weekend. It has also cracked $50 million in Germany ($55.28 million) and is getting close to that milestone in France ($46.14 million). One other note, 2015 became the first year the Walt Disney studio earned $5 billion worldwide in one calendar year. It is still well behind the overall record of $6.8 billion, set by Universal this year.
More...
December 28th, 2015

Star Wars: The Force Awakens easily won the weekend race, but not by as much as anticipated. On the other hand, Daddy's Home was a surprise hit and should cruise to $100 million. None of the rest of the new releases really bombed and most will end their runs as midlevel hits. Overall, the box office fell just 5.1% from last weekend to $295 million, which is the second biggest combined weekend of all time. It was also 41% bigger than the same weekend last year and 2015's year-over-year lead grew to 7.0%. It looks like the 2015 box office will reach $11 billion when all is said and done, but we won't know for sure till we get the absolute final numbers.
More...
December 27th, 2015
The Star Wars juggernaut continues to roll through box office records all around the world this weekend. It will pass $1 billion globally today, Sunday, in just its 12th day in release—one day faster than Jurassic World. That blockbuster figure is largely thanks to an incredible $544 million after just ten days domestically, far ahead of Jurassic World’s $402 million at the same point in its run. The Force Awakens has now broken records for every milestone from $50 million to $500 million, with more to fall. The current record for fastest to $550 million is also Jurassic World, which reached the mark in 24 days. Star Wars will do it in eleven. After that, we will start looking at some serious all-time records.
More...
December 26th, 2015
Star Wars: The Force Awakens set another record by earning $49.34 million on Christmas Day. This more than doubles the previous record of $24.61 million held by Sherlock Holmes. However, this was only 79% more than it made on Christmas Eve, whereas Avatar rose 107% on the same day in its run. You can't even say Avatar had it easy due to weaker competition, so perhaps the explanation lies elsewhere. Perhaps a lot of people who were scared off by the crowds thus far decided to see the movie on Christmas Eve, because it is historically a slow day a the box office. That’s certainly what I was thinking. Because of this, I'm lowing my expectations for the weekend from $170 million to $160 million. This would have been a good opening weekend result for the film. It will be well above the current Record Second Weekend of $106.59 million by Jurassic World.
More...
December 25th, 2015
Before this year, there was only one film to earn more than $10 million during Christmas Eve, Avatar, which pulled in $11.15 million. This year, Star Wars: The Force Awakens destroyed that record with $27.59 million on Thursday. More impressively, it fell just 27%, compared to the 32% drop-off Avatar dealt with back in 2009. From Saturday onwards, The Force Awakens' legs have been almost as good as Avatar's were and I'm worried I might have underestimated The Force Awakens's box office potential this weekend.
More...
December 24th, 2015

Star Wars: The Force Awakens wasn't able to earn first place on the Biggest Wednesday Box Office chart earning $38.1 million yesterday. However, this is the record for best non-opening Wednesday, topping the previous record of $29.07 million, held by The Transformers. Additionally, the film crossed $350 million in just six days, easily breaking the previous record of nine days, held by Jurassic World.
More...
December 23rd, 2015
There are five wide releases / wide expansions this week, none of which will even come close to Star Wars: The Force Awakens' second weekend of release. The rest of the box office combined won't come close to The Force Awakens' sophomore stint. It looks like Daddy's Home has the advantage for second place, while Joy should be close behind. The Big Short expands wide on Wednesday and its five-day total should be close to the previous two films' three-day totals. On the downside, it looks like both Concussion and Point Break will open on the outside of the top five. The Force Awakens will make more than the entire top ten made this weekend last year, so 2015 will end the year on a very positive note in the year-over-year comparison.
More...
December 23rd, 2015
As expected, not opening in China cost Star Wars: The Force Awakens the international opening weekend record, as it earned $281 million, which is behind Jurassic World’s opening international weekend of $316.1 million. However, The Force Awakens did set the worldwide opening record with $529 million, just ahead of Jurassic World’s mark of $525 million. This is especially impressive, as Jurassic World opened with just over $100 million in China. Even a slower than expected opening in China would have given The Force Awakens the first $600 million global opening.
More...
December 23rd, 2015
Star Wars: The Force Awakens set two more records on Tuesday with $37.3 million for the day, making it the highest grossing Tuesday of all time, just topping The Amazing Spider-Man. It won’t break the records for Wednesday or Thursday as there are too many films that have opened on those days to compete with. However, The Force Awakens did set the record for fastest to $300 million, beating Jurassic World there by three full days. The film will reached $350 million tonight and $400 million on Friday, setting records for both of those milestones too.
More...
December 22nd, 2015
Another day, another record for Star Wars: The Force Awakens as it earned an estimated $40.1 million on Monday. This obliterates the previous Monday record, which was held by Spider-Man 2 at $27.66 million. It also shaved a day off the previous record for Fastest to $250 million beating Jurassic World yet again. (Jurassic World still holds the record for Biggest Saturday, so at least it is not being completely erased from the record books.)
More...
December 21st, 2015

It's been a busy weekend for box office record watchers, as Star Wars: The Force Awakens destroyed the record book. However, it wasn't the only film playing in theaters. The Force Awakens earned $247.97 million, which by itself is the 11th biggest Combined Box Office. Add in Alvin and the Chipmunks: The Road Chip and Sisters, the new limited releases and all of the holdovers, and the total box office reached $313 million, topping the old record of $274 million. Needless to say, the overall box office was higher compared to last weekend by 304%. It was also higher than last year by a margin of 131%. Year-to-date, 2015 has earned $10.13 billion, putting it 5.9% or $560 million ahead of last year's pace. 2015's lead over 2014 grew by more than 1.5 percentage points / $160 million over just one weekend.
More...
December 21st, 2015
The final weekend numbers are in for Star Wars: The Force Awakens and it crushed the previous record with $247,966,675 million. This is 19% more than Jurassic World’s opening record and better than our Saturday Analysis had it pegged at. I think the reason it did so much better is the number of sold out screenings. Friday’s numbers were artificially lower, because so many screenings were sold out that people who would have gone to see the movie on Friday simply couldn’t. Additionally, the film’s reviews are among the best for any wide release this year, so the word of mouth certainly should be a factor here. We don’t have final numbers for all films that were in theaters this weekend, but yet another record has been broken: the Biggest Combined Weekend Total.
More...
December 20th, 2015

Disney is projecting a $238 million opening weekend for Star Wars Ep. VII: The Force Awakens as of Sunday morning, a figure that will make it, by some margin, the highest-grossing film on opening weekend at the domestic box office. Jurassic World holds the current domestic record, at $208.8 million. Given the $30 million over-performance at home, it’s perhaps a slight surprise that Star Wars isn’t also projected to take the global weekend record, with its expected $517 million falling a little behind Jurassic World’s $524.9 million debut earlier in the year. That’s one of a handful of examples of Star Wars placing second all-time as of Sunday morning, but mostly it’s been a case of broken records all round, and there’s evidence that Disney is playing things safe in their projections, so pretty much no record can be considered out of reach at this point.
More...
December 19th, 2015
It looks like opening in China late could cost Star Wars: The Force Awakens the record for biggest international opening weekend. The film added $56.8 million on Friday, which is an amazing number, but it is behind the $60 million Jurassic World earned during its first Friday. The two films’ three-day running tallies are remarkably similar at $129.5 million for The Force Awakens vs. $130 million for Jurassic World. As for the new releases on Friday, Spain led the way with $3.5 million. The record for biggest opening day in that market is currently held by The Twilight Saga: Breaking Dawn - Part 2 at $3.5 million, so we are going to have to wait for final numbers to figure out if that record fell. Meanwhile, the film managed $3.2 million on Friday in Japan, toppling the previous record for opening day in that market previously held by Pirates of the Caribbean: At World’s End. On the other hand, the film had to settle for second place in South Korea behind local hit The Himalayas.
More...
December 19th, 2015

We have more international numbers for Star Wars: The Force Awakens and they are all positive. We’ve already talked about the U.K. numbers, but we learned the film opened in first place in Germany on Thursday, scoring $7.1 million, which is the biggest single day in that market. It also had the biggest opening day in Australia ($6.8 million); Brazil ($2.7 million); and many, many other smaller markets. Overall, it pulled in $58.6 million in 44 markets internationally for a two-day total of $72.7 million. With openings in Japan, Spain, and other markets on Friday, the film’s international weekend looks to be near record levels. It is currently roughly 10% ahead of Jurassic World’s two-day pace ($65.6 million), even though that film debuted in China, so if it can continue its hot streak, it will have the global opening weekend box office record ($524.42 million). After this start, even the low end of expectations has it topping $500 million worldwide over the weekend.
More...
December 19th, 2015
With a jaw-dropping $120.5 million opening day safely in the bank, thoughts turn once more to the potential opening weekend for The Force Awakens. An all-time record seems virtually guaranteed, but how high could the film actually go this weekend? Is $250 million likely? $275 million?? Fortunately, we have enough data from previous blockbuster openings to have a reasonable idea of the answer. The signs point to something around $225 million, but the range of uncertainty is still quite high.
More...
December 19th, 2015
Star Wars: The Force Awakens not only broke the single day record, it crushed the previous mark. It became the first film to ever earn more than $100 million in a single day, blowing past that milestone with $120.5 million on Friday. So what does this mean for the rest of the weekend? I have no idea, as we are in completely uncharted territory. Well, that's not entirely true. I do know our Weekend Predictions underestimated the demand for this film. The film does have to deal with the Fanboy Effect. Films with Fanboy appeal tend to have shorter legs, because Fanboys rush out to see the movie opening day / opening weekend. However, there are factors at play here that will likely help its legs over the weekend. Firstly, the film’s word of mouth should be amazing as it is earning 95% positive reviews and an A Cinemascore. Secondly, there were a large number of sellouts opening night, so in many places the Fanboys were forced to wait, because they couldn’t get tickets. Even the low end has The Force Awakens breaking the all-time weekend record. On the high end, it could top $250 million. If the film does earn $250 million during its opening weekend, then $1 billion domestically is on the table. An opening weekend around $230 million is more likely. Our model has it earning $225 million—Bruce will have a piece on that shortly—but that still puts $800 million, and yet another record, in the film’s sights.
More...
December 18th, 2015
Star Wars: The Force Awakens broke Harry Potter and the Deathly Hallows, Part II’s record for biggest previews by scoring $57 million on Thursday evening. It didn’t just beat the old record, it destroyed it. $57 million is 31% more than the previous record of $43.5 million. This bodes very well for the film’s box office chances, both for today and for the full weekend. On the downside, there are reports that men made up 70% of the audience, which is really high. It could be that women stayed away for the most part because they were worried about the crowds and that the gender balance will be different the rest of the weekend. We should have more information on that by Monday.
More...
December 18th, 2015
Another day, another record for Star Wars: The Force Awakens. This time it is the opening day record in the U.K., where the film earned $14.3 million. That’s right, the film earned more in the U.K. than it did in all 12 markets it opened in yesterday. Not only did The Force Awakens break the single-day record previously set by Spectre earlier this year, but analysts think it could double the current opening weekend record of $31.2 million, also held by Spectre. Of course, Spectre was also a Monday debut, so the comparisons are not perfect, but it does show just huge The Force Awakens will be.
More...
December 17th, 2015

We have some early international numbers for Star Wars: The Force Awakens and it is good news all around. The film managed $14.1 million in the 12 markets where it opened on Wednesday, including $5.2 million in France. This is the biggest non-holiday opening day in that market and the second-biggest opening day of all time, behind Spectre. It opened with $2 million in Italy, which is the biggest opening day in December there, doubling the previeous record set by The Hobbit: The Battle of the Five Armies.
More...
December 17th, 2015
There are three wide releases this week, but only one of them matters: Star Wars: The Force Awakens. Better than anticipated reviews could help it break records over the weekend. It has already broken some box office records, becoming the first film to reach $100 million in advance ticket sales. The other wide releases are Alvin and the Chipmunks: The Road Chip and Sisters, both of which are just trying to not completely disappear. This weekend last year, the total box office was $135 million. The Force Awakens could earn nearly 50% more than that and some would still see it as a disappointment. 2015 should extend its lead over 2014 by more than $100 million.
More...
December 16th, 2015
The review embargo for Star Wars: The Force Awakens was lifted at midnight, and there are now over 100 reviews on Rotten Tomatoes. Before we get into the specifics, let’s talk about some benchmarks. If the film’s reviews were in line with The Phantom Menace’s, then it would be in trouble. On the other hand, I would be satisfied if it merely matched Revenge of the Sith or Return of the Jedi, both of which earned 79% positive. Anything above 85% positive reviews would be a major success. So what is The Force Awakens’ Tomatometer Score?
More...
December 15th, 2015
Its Tuesday the 15th and you know what that means? It’s just a week away from the Steam Winter Sale!!! ... Also, Star Wars: The Force Awakens opens in just over 48 hours. Today we look at just how big The Force Awakens can be. Can it become the biggest hit of all time? If so, what path would it have to take to get there?
More...
December 10th, 2015
Expectations are a dual-edged sword. On the one hand, great expectations can drive people to theaters when they might not otherwise do so. On the other hand, great expectations can mean a movie could open with $100 million and still be considered a disappointment. Today, we list the eight records that Star Wars: The Force Awakens needs to break to be considered an unqualified success. It doesn’t need to break all of them, but it will need to break at least half of them. Unlike our previous article, when we ranked the records by how likely they were to fall, this time we are ranking them in chronological order. This way you can play along and tell immediately if The Force Awakens will merely be a blockbuster, or something special.
More...
December 8th, 2015
The Force Awakens opens in theaters in less than two weeks, and the hype is growing. In fact, it now looks like the film could break well over a dozen major records during its box office run, not including some of the more esoteric records, like biggest non-opening Wednesday (currently $29.07 million, and held by Transformers, in case you were wondering.) That’s a lot records to keep track of. So in the lead up to the launch, we will be looking at these possible records divided into three groups. Today, we are going to look at the records we think are the most likely to fall: the ones we think have a 90% chance or better of being broken by The Force Awakens. In fact, in some cases, they have already fallen.
More...
December 1st, 2015
November ended on a positive note with a strong Thanksgiving weekend. Even so, the overall numbers were mixed with a lot of misses mixed in with a few hits. It was better than October and we will call that a victory. Meanwhile, December is potentially record-breaking. Actually, given the evidence, it is almost assuredly going to be record-breaking. Star Wars: The Force Awakens has already set a record for the most money taken from ticket pre-sales and the biggest December weekend will fall. The pre-orders alone will guarantee that. On the downside, it is very likely that no film will make as much in total as The Force Awakens will make during its opening weekend. There's a chance no film makes in total as much as The Force Awakens makes during its opening day. There are a few films that have a shot at $100 million. For example, Joy should get there, if it becomes a major player during Awards Season. If not, it will at least come close. Daddy's Home, and to a lesser extent Sisters, could be surprise $100 million hits. However, like the rest of 2015, December is shaping up to be a month of a record-breaking hit and a lot of films that struggle just to get noticed. On the other hand, last December, was a lot more balanced at the top with four films earning more than $100 million, led by The Hobbit: The Battle of the Five Armies. There's a chance The Force Awakens earns more than all four $100 million hits from last year earned combined.
More...
November 9th, 2015
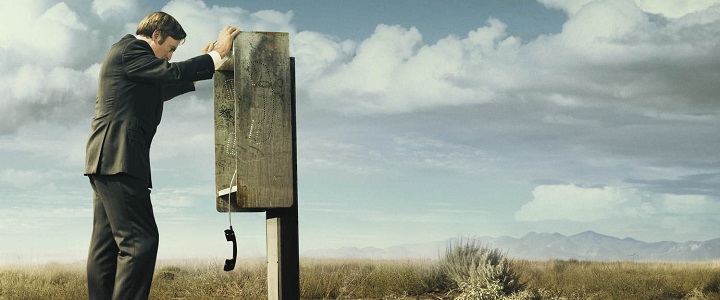
There are a couple of big hits on this week's list of new releases. Terminator: Genisys was a monster hit internationally, but it failed to live up to expectations here. On the other hand, Trainwreck earned $100 million here, but barely made a peep internationally. Of these two films, Trainwreck is the only one worth picking up. In fact, it is a Contender for Pick of the Week. However, I'm still waiting for the screener and I hate to give out this title when a screener is on its way. Because of that, I'm going with Better Call Saul: Season One as the Best of the Best, but it isn't the only other title worth picking up.
More...
October 13th, 2015

There are two $100 million movies on this week's list of Home Market Releases: Spy, which earned more than $100 million domestically, and Tomorrowland, which merely cost more than $100 million to make. Spy is arguably the best release on this week's list, but the Blu-ray was already named Pick of the Week, so that honor is going to Aladdin's Blu-ray debut this week.
More...
November 9th, 2014
Star Wars: The Clone Wars was a digitally animated TV series that took place inbetween Episode II and Episode III. It lasted five seasons before being canceled. It was than revived by Netflix roughly 30 seconds later. (There were many episodes completed or nearly completed at the time the show was canceled.) These 13 episodes are being released on DVD or Blu-ray this week. Are they worth checking out for fans of the show? Or was there a reason the show was canceled before these could be shown?
More...
April 22nd, 2014
Captain America: The Winter Soldier won the weekend box office race with a better than expected result and this helped it reach $200 million. Likewise, Heaven is for Real was surprisingly strong earning second place over the weekend, despite opening on Wednesday. Unfortunately, none of the other new releases lived up to expectations and the overall box office fell 5% to $133 million. This was still 20% higher than the same weekend last year, boosting 2014's lead over 2013 to 8% at $2.92 billion to $2.70 billion.
More...
October 14th, 2013
It's a good week on the home market with two $100 million hits coming out: The Heat and Pacific Rim. I've heard good things about both films, but unfortunately, neither screener has arrived. Also, while we have two big release on top, there's not a lot of depth and we quickly run into releases that would be filler during a normal week. At the time I started this column, no new releases for the week had arrived on time, but at least that gave me a chance to get a bit caught up on some of the previous late arrivals. This list includes two contenders for Pick of the Week: White Collar: Season Four and Modern Family: Season Four on DVD or Blu-ray. Both are must haves, but the latter won out for Pick of the Week honors.
More...
March 30th, 2013
Willow came out 25 years ago. It was a fantasy epic that cost $50 million to make and was written by George Lucas, who was coming off of Star Wars and Indiana Jones. It was directed by Ron Howard, who hadn't yet had any monster hits, but both Splash and Cocoon were very profitable and well received. This film had high expectations. It didn't live up to them. Its reviews were merely mixed and it came nowhere near becoming the $100 million hit like a lot of people thought it would. Now that 25 years have passed and the expectations are not there, does it work? Or would it have failed to find an audience even with lowered expectations?
More...
November 18th, 2012
The beginning of the end for the Twilight franchise is here, and, as expected, big money is being made by Lionsgate/Summit. While this installment doesn't look like it will break franchise records, Lionsgate is predicting a $141.3 million opening weekend, which will be the 8th-best of all time, assuming it holds up. New Moon will most likely remain the top opener for the franchise with $142.8 million, although it will be a close-run thing. Twilight will most likely end up the 5th-highest-grossing franchise at the domestic box office, behind only the "box office gods", Harry Potter, Star Wars, Batman and James Bond.
More...
-2-News.jpg)


-5-News.jpg)
-4-News.jpg)
-2-News.jpg)
-3-News.jpg)
-8-News.jpg)
-6-News.jpg)
-3-News.jpg)
-1-News.jpg)