This is a strange week on the home market. We have one of the biggest domestic hits of the year, Suicide Squad, but it is one of the worst movies I’ve seen this year. (Granted, I’ve done fewer reviews this year and skipped a lot of terrible looking movies, like Independence Day: Resurgence, Warcraft, Gods of Egypt, Allegiant... Ben Hur, The Huntsman, The Legend of Tarzan. I could keep going. Wow! It was a bad year for $100 million movies.) After Suicide Squad, the next biggest release according to Amazon is the Chicago Cubs 2016 World Series Collector's EditionBlu-ray. That’s a huge drop in sales. As far as quality is concerned, I have to give a shout out to that World Series Blu-ray. Real fans want full games and this one provides them. On the other hand, I personally find baseball boring to watch. Unfortunately, there’s no one release that stands out as an obvious Pick of the Week, but instead we have a lot of releases that are close, but wouldn’t be close enough during a good week. The Twilight Zone: The Complete Series on Blu-ray is the best, assuming you didn’t grab the individual seasons when they came out.
More...
October begins with a trio of wide releases, led by The Girl on the Train. The film’s reviews are mixed, which is not ideal, but also not fatal. The Birth of a Nation was looking to become an Awards Season player, but its reviews are not quite at that level. Finally there’s Middle School: The Worst Years of My Life. There are still no reviews and the buzz is as quiet as you can get for a wide release. This weekend last year, the only wide release was Pan and it bombed hard. However, The Martian remained on top with $37.01 million over the weekend. There’s almost no way The Girl on the Train will match that and last year had better depth as well. 2016’s slump will continue.
More...
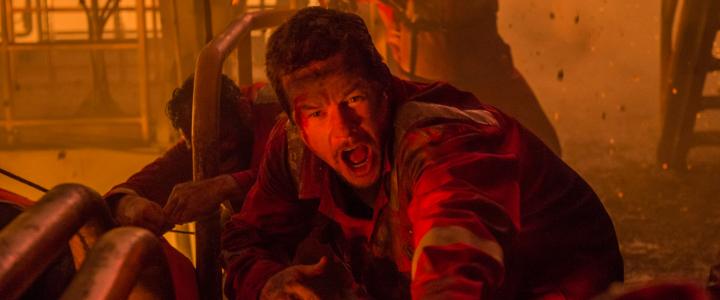
The overall box office was about as strong as expected, as Miss Peregrine’s Home for Peculiar Children beat expectations by the same amount as Deepwater Horizon missed expectations. This helped the overall box office grow 10% from last weekend to $114 million. However, this is still 24% lower than this weekend last year. Year-to-date, 2016 still has a lead over 2015, but that lead has shrunk to 4.9% or $390 million at $8.50 billion to $8.10 billion. If 2016’s lead falls below $325 million, then we will need to panic. Remember, last year ended with Star Wars: The Force Awakens, which earned $650 million before the end of the year. Rogue One isn’t expected to earn half of that, so 2016 is going to need a $325 million lead or it will need better depth in order to come out ahead. I would prefer the former.
More...
Miss Peregrine’s Home for Peculiar Children earned $1.2 million during its Thursday previews, which is just ahead of the $1.1 million earned by The Maze Runner back in 2014. Unfortunately, there’s a question whether we should treat this as a young adult book adaptation, or whether we should treat it as a more gonzo Tim Burton offering. If we go that route, there are no really good comparisons. Dark Shadows earned $550,000, but that was just over four years ago when midnight screenings weren’t standard and far fewer people went overall. Regardless, this is a better start than expected and an opening weekend of $30 million is more likely than it was before.
More...
An eclectic bunch of films debuts in theaters this weekend, and the favorite to top the chart will be playing in the most theaters. Miss Peregrine’s Home for Peculiar Children starts out in 3,522 locations—a very respectable total, but some way short of the 3,922 and 3,674 theaters that launched Storks and The Magnificent Seven, respectively, last weekend. Sully played in a virtually-identical 3,525 venues when it opened a few weeks ago, so there’s scope for a good opening for the Tim Burton fantasy flick.
More...
Three wide releases come out this week: Deepwater Horizon, Miss Peregrine’s Home for Peculiar Children, and Masterminds. Deepwater Horizon’s reviews are better than expected and that should help it at the box office. Miss Peregrine’s reviews are on the razor’s edge of the overall positive level. Meanwhile, there are not enough reviews to really judge Masterminds, but the early signs don’t look good. This weekend last year was the first weekend of October. The Martian nearly broke the record for biggest October weekend. There’s a chance all three wide releases this week won’t match The Martian’s opening weekend. Add in last year’s depth and there’s almost no chance 2016 will come out ahead on the year-over-year comparison.
More...
August continued to pad 2016’s lead over 2015 in the year-over-year comparison. It managed this feat almost entirely due to Suicide Squad, which is on pace to hit $300 million. The next best film was Sausage Party, which might make $100 million, if it gets a push over the top. September won’t be as strong as that. This is no surprise, as the month is one of the biggest dumping grounds on the calendar. That said, studios have been working to make the end of the month a lot more productive and there are a few potential hits. The biggest of these is The Magnificent Seven, which is expected to crack $100 million, maybe even $150 million. Meanwhile, Sully and Storks both have a limited chance at $100 million. Last September, the biggest release of the month was Hotel Transylvania 2 with pulled in $169.70 million. I don’t think The Magnificent Seven will match that, so we might need a surprise $100 million hit for 2016 to come out on top.
More...
The third installment of the Holiday Gift Guide focuses on smaller releases, movies that opened in limited release, foreign films, classics getting new releases, and a few Canadian films. This year the list looks different to the previous guides for a simple reason. While there were only eight releases on the TV on DVD installment of the holiday gift guide, the first pass had more than 30 films on this list. I tried trimming the list, but that resulted in me remembering more films I wanted to add to it. Even after getting rid of the ones that won't be released until after Christmas, like Bone Tomahawk, there are still way too many releases to deal with. So let's not delay anymore and get to the list, starting with the biggest release...
More...
2014 is over and for the most part, December was a soft ending to a weak year. This is bad news for two reasons. Firstly, it means the overall box office is still soft and it is unlikely that January will start strong. Secondly, last January was a great month, thanks in part to Frozen and other holdovers. The slump can't last forever and Taken 3 should help 2015 get off to a reasonably fast start and it even has a shot at $100 million. American Sniper got off to a really fast start in limited release, so it too could be a hit when it expands wide. By comparison, last January was led by Ride Along, but there were only two other films that didn't completely bomb. I want to say 2015 will start out on a winning note, but given the box office losing streak, it will likely pay to be pessimistic.
More...
With the recent weak performance of films such as Transcendence and Edge of Tomorrow at the box office, there’s been a lot of talk recently about how much actors and actresses are really worth to a film. The poor performance of these films hasn’t come as a huge surprise to followers of the Bankability Index, which produces valuations considerably below the $20 million that Johnny Depp reportedly earned from his lead role in Transcendence, and we thought this is a good opportunity to look at what the Index says about the most valuable actors and actresses in the business.
With Angelina Jolie making headlines for all the right reasons for her starring role in Maleficent, it seemed only fitting to start with an analysis of the most valuable actresses in Hollywood. For this chart, we’ve taken each star’s worldwide Bankability Index and divided it by the number of films they make each year to get an estimate of the average value they bring to a film, as of June, 2014.
More...
It's the day after Memorial Day, which means we are in the summer season, which is a terrible time for the home market. The only first-run release of the week is Dark Skies, which is hardly a major release. There are a few summer TV shows that are coming out on DVD and / or Blu-ray, some of which are interesting. The latest season of Doctor Who is coming out this week, but it is being split, and not just into two parts, so that precludes it from being a Pick of the Week contender. There are not a lot of options for Pick of the Week, but I'm going with Beetlejuice: The Complete Series, but keep in mind there could be some nostalgia at work here and Lore on DVD or Blu-ray is arguably the better release. Meanwhile, Hellbound? on DVD earns the rarely awarded Puck of the Week for best Canadian release.
More...
Tim Burton is one of the most stylish directors around and while admittedly he sometimes lets the style get ahead of the story, he has still made many, many wonderful movies over the years. His latest is also one of his first. Way back in 1984, he made a short film called Frankenweenie. Last year, he remade the short as a feature-length stop-motion animated film, Frankenweenie. The film struggled to find an audience, but was that because it didn't deserve an audience? Or has Tim Burton burned up too much of the good-will he generated earlier in his career.
More...
After two weeks of almost nothing worth talking about on the home market, there's plenty to talk about this week. ... Actually, to be totally honest, it is another slow week, it's just not painfully slow. (Also, I'm unwilling to pad the list like I had to do the last couple weeks.) Worse still, because the holiday just ended, a lot of the screeners that were supposed to arrive have not, including a few Pick of the Week contenders. Compliance, Dredd, and Frankenweenie are all contenders that are currently late, and I really don't like choosing a late screener. In the end, it was literally a coin toss between Archer: Season Three on DVD or Blu-ray and Red Dwarf: X on DVD or Blu-ray. And the coin said... Red Dwarf: X.
More...
There are only a few days left till Christmas and we are officially in the panic zone for gift shopping. This week we have our final installment of our annual Holiday Gift Guide. Part I dealt with first run releases, Part II dealt with TV on DVD releases, Part III dealt with limited releases, foreign titles, and classics. This week, we deal with some music, books, games, as well as releases from the first three parts that I forgot the first time around. As always, there are quite a few in that last category. (I also use this time to burn off some releases that arrived late. This way I can get through all of the late reviews quicker than normal and actually have enough time to celebrate Christmas.)
More...
This weekend, there are two wide releases making their debuts, Taken 2 and Frankenweenie. Plus a previous limited release is aiming for a spot in the top five, Pitch Perfect, and another limited release that could expand into the top ten, The Perks of Being a Wallflower. It's an all around busy weekend. Taken 2 should easily win the box office race earning more than the original, although it very likely won't have the same legs. More importantly, it should open with more than last year's number one film, Real Steel. The second best wide release should open better than Ides of March did, plus the holdovers this year are better than last year. Am I getting optimistic again? Yes. Keep in mind that I have had the optimism crushed a lot this year.
More...
It's the first week of the month and there is a wide variety of releases worth checking out, but not exactly a strong selection of best sellers. The biggest first-run release is Dark Shadows and while I'm looking forward to possibly reviewing the Blu-ray Combo Pack, I don't think it will be a huge hit. New Girl: Season One and The Princess Bride: 25th Anniversary Edition Blu-ray look great, but I'm waiting for the screeners to make final decisions. I won't get a chance to review Universal Classic Monsters: The Essential Collection, but it is a contender for Pick of the Week. The winner of that honor is CinderellaBlu-ray, which is a classic, even if it is a little old-fashioned.
More...
2012 continues its downward path. After a record-breaking spring, thanks to The Hunger Games, and a record-breaking start to the summer, thanks to The Avengers, the box office hasn't been able to maintain any real momentum. For most of the month, September was no better than August and now the year-over-year gains are just a little more than inflation. October will need to improve or 2012 will be in real trouble. Unfortunately, that might be tough. There's not a single film coming out in October that looks like it will be a guaranteed $100 million hit and there are only two films with a realistic chance, Taken 2 and Paranormal Activity 4. (There's also Cloud Atlas, which is a wild card. That movie could bomb or be the biggest hit of the month and I wouldn't be surprised either way.) There is a chance all three will get to the century mark, but there's a better chance none of them will. Last October, two films cracked $100 million: Paranormal Activity 3 and Puss in Boots, with the latter nearly reaching $150 million. I don't see any film coming close to matching that figure. On the other hand, last year there were six films that one could accurately describe as bombs. So while 2012 is weaker at the top, it could have better depth than 2011 did. Let's hope so, because we can't afford more bad news.
More...
All Acting Credits
Register with The Numbers for free to customize this chart.


-4-News.jpg)


-1-News.jpg)

