This graph shows Tom Hanks’s score on our annual analysis of leading stars at the box office. The Star Score represents points assigned to each of the leading stars of the top 100 movies (based on box office) in the current year and two preceding years. For appearing in the number one movie in a year a star gets 100 points, the number two movie 99 points and so on..
Latest Ranking on Selected Box Office Record Lists
Our widest releases list this week is close to being a replay of last week with A Man Called Otto still occupying the top spot by playing in 3,957 cinemas. The Tom Hanks comedy-drama has scored just short of $60 million worldwide to date during its four-week run.
More...
Missing likely to meet expectations, but needing to do much better than that to conquer the current champion. Avatar will cruise past $2 billion globally this weekend and isn’t done yet.
More...
After spending five weeks as the widest release, Avatar: The Way of Water finally drops into the second spot, going from 4,045 locations last week, to 3,790 this week. In its place, the widest release this week will be A Man Called Otto. After expanding into 3,802 theaters last week, the film retains that count this week. The Tom Hanks comedy-drama has earned just over $25 million since debuting in just four cinemas on December 30.
More...
In yesterday’s weekend prediction column, I asked whether Avatar: The Way of Water will perform like a “normal” movie or a “Cameron movie” on its fourth weekend. This morning, we got the answer. With Disney estimating $11.406 million in receipts on Friday, Way of Water continues to trend better than movies usually do, but is beginning to look more like a regular film. It should top $40 million this weekend, which is excellent by any standards, but a little more back in the world of the mortals. Here’s my analysis this morning…
More...
Avatar: The Way of Water will top the box office chart again this weekend, as its seemingly unstoppable run continues into the New Year. The big question is when it will start losing momentum, and this weekend is the first big test it has faced, partly because M3GAN is looking to get 2023 off to a good start. Here are our model’s predictions going into the weekend…
More...
After making its North American debut on December 16th, Avatar: The Way of Water has amassed a staggering $465 million from a steady 4,202 locations. Internationally, the James Cameron juggernaut has performed even better, scoring $1.05 billion since its release, already eclipsing the $769 million that Top Gun: Maverick earned during its seven-month run. Way of Water actually adds 138 viewing locations this week, making it once again this week’s widest release, playing in 4,340 venues. We will at least have one brand new wide release this week to give it some competition.
More...
After 13-days at the domestic box office, Avatar: The Way of Water stands alone with $337.8 million, while taking in a whopping $762.8 million overseas since its release. With $1.1 billion already surpassed globally — and before the end of its second play week — it ranks as the #2 release of 2022 and #3 release of the pandemic era. The sequel will retain its debut count of 4,202 theaters this week, once again making it the widest release of the week.
More...
While it has taken a back seat to both Top Gun: Maverick and Jurassic World: Dominion this week at the box office, Lightyear will become the widest release this weeked, albeit due Dominion dropping 400+ locations. While the Toy Story spinoff didn’t exactly hold up to the majority of expectations, the film has still garnered over $67 million in domestic revenue as of Wednesday. Pixar’s Lightyear keeps its opening count of 4,255 theaters as it heads into its sophomore outing.
More...
The worst year for the movie theatrical industry in a century will end with a series of releases that might define the business for the next decade. Only three of the major studios are daring to release films in theaters during what is shaping up to be the height of the COVID-19 pandemic. Sony Pictures is going the traditional route with Monster Hunter getting an exclusive theatrical release on Christmas Day. Universal’s deals with AMC and Cinemark to allow shortened theatrical windows in return for sharing PVOD revenue have prompted it and its specialty division Focus Features to release four films this holiday season. But all eyes (or many of them, anyway) will be on Warner Bros.’ release of Wonder Woman 1984 simultaneously in theaters and on HBO Max.
When the studio announced this release strategy back on November 18 there was speculation that, if it worked out well, they might do the same thing with some of their other upcoming films. Today they threw caution to the wind and announced that all of the studio’s 2021 films will be released in theaters and on HBO Max at the same time (in territories where HBO Max is available). While we’re still digesting the news, here are three quick takes on the rationale for Warner Bros. to make this bold leap.
More...
Five years after the end of the Civil War, Captain Jefferson Kyle Kidd, a widower and veteran of three wars, now moves from town to town as a non-fiction storyteller, sharing the news of presidents and queens, glorious feuds, devastating catastrophes, and gripping adventures from the far reaches of the globe. In the plains of Texas, he crosses paths with Johanna, a 10-year-old taken in by the Kiowa tribe six years earlier and raised as one of their own. Johanna, hostile to a world she’s never experienced, is being returned to her biological aunt and uncle against her will. Kidd agrees to deliver the child where the law says she belongs. As they travel hundreds of miles into the unforgiving wilderness, the two will face tremendous challenges of both human and natural forces as they search for a place that either can call home.
More...
The first week of the month is usually the busiest for streaming services, so it is no surprise that this week is slower than last week. There are a few interesting items on this week’s list though, and it’s a sign of the times that some of the biggest names at the box office are in leading roles. Greyhound, the World War II action movie starring Tom Hanks, is the standout release of the weekend, and Charlize Theron, Andy Samberg, and Cate Blanchett all have new movies or shows debuting.
More...
In the early days of WWII, an international convoy of 37 Allied ships, led by captain Ernest Krause in his first command of a U.S. destroyer, crosses the treacherous North Atlantic while hotly pursued by wolf packs of Nazi U-boats.
More...
The Oscars were handed out last night and unlike most years, I wasn’t able to live-blog the awards. This is a real shame, because it was one of the best Oscar nights I can remember and there were very few awards that made me legitimately angry, unlike many years in the past. There was even a surprise winner for the full night, as Parasite earned the most wins with four Oscars. It is incredibly rare for a foreign-language film to pull off that feat.
More...
Our annual Oscar Prediction contest underway so now is the best time to look at the nominees and try and figure out who the favorites are and which films should just feel honored to be nominated. We are continuing our schedule with Best Supporting Actor. This might be the least competitive category we talk about this year.
More...
The Oscar nominations were announced on Monday, and the results were... well, there were some puzzling results. Joker led the way with eleven nominations. ... A film with 69% positive reviews earned the most nominations. It’s not the worst-reviewed movie to earn a Best Picture Nomination—after all, Bohemian Rhapsody was nominated just last year. However, this film is arguably the worst-reviewed movie to ever earn the most nominations in a single year.
More...
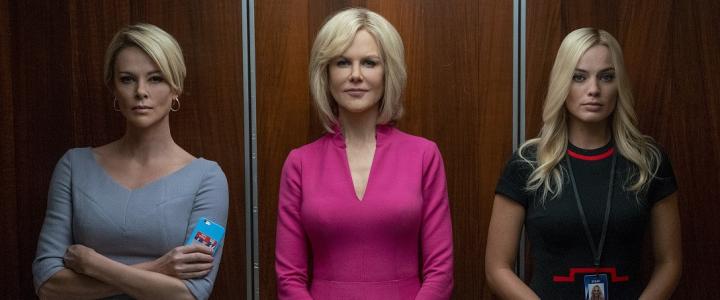
The Screen Actors Guild announced their nominations this week and we are starting to see some patterns with similar names appearing over and over again. This time Bombshell led the way, earning four nominations, but four other films earned two or more nominations.
More...
The Golden Globes nominations are the second major Awards Season set to come out. It is still very early in the year and the predictive value of the Golden Globes is a little suspect, but there are still some things to learn here. (This is especially true on the TV end, as there’s talk about how strange the nominations are this year.) Marriage Story led the way with six nominations, just ahead of The Irishman and Once Upon a Time... in Hollywood, both of which picked up five nods.
More...
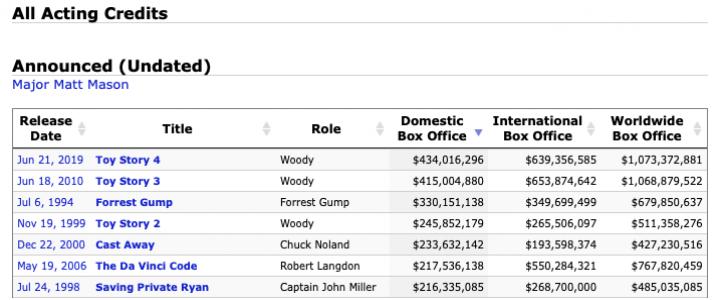
Our latest site improvement is the ability to sort the columns on the Acting Credits and Technical Credits tables. These tables now allow you to arrange in ascending or descending order an actor or crew member's filmography by release date, title, role, domestic box office, international box office, and worldwide box office.
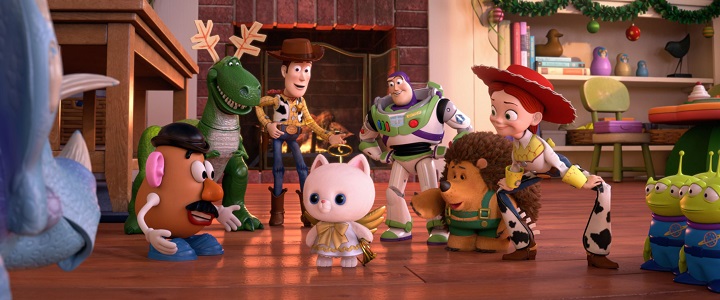
Toy Story 3 gave the franchise such a perfect send off that when Toy Story 4 was first announced it was met with a lot of trepidation. Most assumed it would be impossible to live up to its predecessor and many were worried it would fail at that task so much that it would retroactively make the franchise worse. Was it able to do the impossible? If not, was it at least able to avoid being a disaster?
More...
After a jaded magazine writer is assigned a profile of Fred Rogers, he overcomes his skepticism, learning about empathy, kindness, and decency from America’s most beloved neighbor. Based on the true story of a real-life friendship between Fred Rogers and journalist Tom Junod.
More...
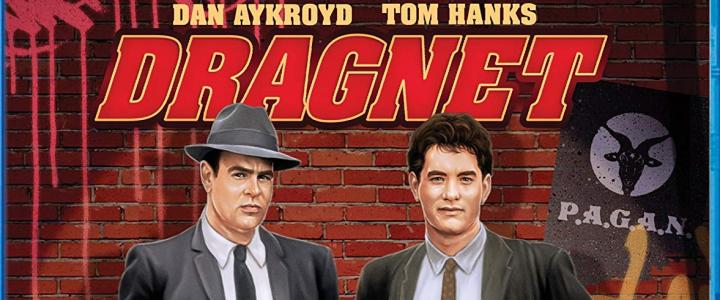
Dragnet is a continuation of the 1950s / 1960s police procedural TV series of the same name. It isn’t exactly a remake, as Harry Morgan reprises his role as Bill Gannon, but it is certainly a more comedic take on the show. I remember loving this movie as a kid, but I also haven’t seen it since I was a kid. Has it aged well? Or am I going to be forced to use the “I was young.” excuse?
More...
2017 wasn’t a good year. It started out well and ended on a high note, but the summer was a disaster and that proved to be too much for the rest of the year to overcome. Fortunately, The Last Jedi and Jumanji: Welcome to the Jungle are still doing very well and will help January get off to a fast start. Unfortunately, the biggest new release of January is Paddington 2 and it isn’t expected to match its predecessor at the box office; it certainly won’t top $100 million domestically. It is unlikely any of the Oscar contenders will hit the century mark in January either. This is really bad news, as last January, we had a new release, Split and an Oscar contender, Hidden Figures, which both topped that milestone with ease. 2018 should get off to a faster start in the first two weeks, but overall, this month will end with a loss.
More...
The Golden Globes nominations are the second major Awards Season set to come out. Sort of. (WGA announced the nominations for TV, radio, etc., but not their theatrical nods.) It is still very early in the year, so it is hard to say if there are any real snubs, or if there are any real favorites. The Shape of Water led the way with seven nominations, while The Post and Three Billboards Outside Ebbing, Missouri were right behind with six a piece.
More...
The Numbers celebrates is 20th anniversary this week and we have previously looked at the history of the site and its present size and scope. We wrap things up with a look at the future. The future will involve a lot more new features and this week we introduce two of the most recent two: Box Office Records for people and Weekly Breakdowns in the Annual Summaries.
More...
April comes to end with two wide releases that have modest ambitions at the box office. The Circle opens in 3,163 theaters for STX Entertainment, who will be happy if it beats The Bye Bye Man’s $13.5 million opening weekend and becomes their second-best opening to date (Bad Moms holds the record for the studio, with $23.8 million—a number they would be thrilled with). Speaking of records, The Circle holds a very unusual one…
More...
The last weekend in April is usually a terrible weekend and this year is no different. There is only one truly wide release this week, The Circle, although How to be a Latin Lover has a shot at the top five. There are also two films opening in approximately 500 theaters hoping to sneak into the top ten: Sleight and Baahubali 2: The Conclusion. However, while it seems like a busy week for new releases, The Fate of the Furious will easily remain in first place. In fact, the top five this week could be nearly identical to the top five last week, with The Circle being the only nearly guaranteed new addition. This weekend last year, The Jungle Book led the way with $44 million, while the biggest new release was Keanu with just under $10 million. The new releases might be stronger this time around, but there’s almost no way 2017 will be able to compete with The Jungle Book.
More...
March was a month of extremes, led by two strong performances: Beauty and the Beast breaking records and Logan cracking $200 million with ease. There were also two other $100 million hits and another potential $100 million hit that we don’t have significant box office numbers for yet. This is fantastic. On the opposite end, there were three films on last month’s list that didn’t even open truly wide. This month won’t be as lucrative at the top, as The Fate of the Furious is the only film expected to top $100 million. Fortunately, it is expected to open with over $100 million. On the other extreme, there are many, many films on this list that I’m not sure will open wide. Fortunately, last April wasn’t any better. The Jungle Book made nearly $1 billion worldwide, but the other nine films combined made less than half of that. To emphasize: the other nine films that opened last April averaged less than $50 million worldwide each. If The Fate of the Furious can just come close to the previous installment of the franchise, then 2017 has a solid shot at topping 2016.
More...
Beauty and the Beast set out this weekend to show that it’s not just super heroes who can deliver big openings at the box office, and it’s doing so in some style. Disney is projecting a $170 million opening weekend for the live action fairytale, and the film is setting records around the world. At home, it’ll have the biggest March weekend of all time, and the fourth-best Saturday of all time. The studio is projecting it will have the sixth-best Sunday in history, although my money would be on it slightly outperforming today, for the fifth-best Sunday, and that it will challenge Iron Man 3’s $174 million for the sixth-best opening of all time. Only Star Wars, super heroes, and dinosaur-themed movies have done better on opening weekend.
More...
September is over and we should all be glad about that. Unless the final weekend brings a surprise $100 million hit or two, 2016’s lead over 2015 will shrink over the month. There were some bright spots, most notably Sully, which will be the biggest hit of the month. On the other hand, we had more outright bombs than even midlevel hits. Sadly, October isn’t much better. There are a couple of films that could be $100 million hits, but most of the films will struggle to become midlevel hits. Both Inferno and The Girl on the Train are aiming for $100 million. One of them might get there too. If both get there, then October will be seen as a success. By comparison, last October was led by The Martian; however, because of a misalignment in the calendar, The Martian’s opening weekend actually lines up with the final weekend in September. It had great legs, so that will help 2015 early in the month, but the rest of the month was terrible last year and I think 2016 will come out ahead as a result.
More...
As expected, this weekend’s three new wide releases couldn’t budge Sully from the top of the chart with the Tom Hanks/Clint Eastwood drama down a very respectable 37% in its second weekend to $22 million, for a total of $70.5 million to date. Two films, Blair Witch and Bridget Jones’s Baby both had aspirations to challenge Sully for the title, but had to settle for second and third place.
More...
There are three wide releases this week, plus another that could sneak into the top ten. Two of the three new releases, Blair Witch and Bridget Jones’s Baby, are expected to do well. On the other hand, Snowden is only going to reach the top five due to the lack of competition. Meanwhile, Hillsong: Let Hope Rise is a faith-based concert film. It could reach the top five, or it could miss the Mendoza Line. There’s no way to predict its box office potential. Despite the number of new releases, Sully is expected to remain in top spot thanks to its reviews and target demographic. This weekend last year, Maze Runner: The Scorch Trials led the way with just over $30 million. It is likely no film will make that this year, while the depth is a mixed bag, so it looks like 2016 will lose in the year-over-year comparison.
More...
Four films opened wide or semi-wide over the weekend, but only one of them, Sully, did well at the box office. It earned more than double its nearest competition, When the Bough Breaks, at $35.03 million to $14.20 million. The other two new releases bombed. Overall, the box office was flat, up 1.1% from last weekend to $101 million. This was also flat when compared to last year, down just 1.7%. Since this weekend was so close to last weekend, it should come as no surprise that the year-over-year comparison hardly moved. This time last week, 2016 was ahead of 2016 by just over 6.7%, while this week its lead is just under 6.8% at $8.10 billion to $7.58 billion.
More...
Sully is the only new release not to disappoint this weekend, as it earned $12.21 million on Friday. This is well ahead of Tom Hanks’ recent trio of real-life movies. It tops Captain Philips’ opening day by nearly 50%, and that movie went on to earn more than $100 million domestically. Additionally, the film’s reviews improved and hit 84% positive. That’s on the low end of potential Awards Season buzz, but it isn’t impossible to get there. It also earned a solid A from CinemaScore, which suggests good word-of-mouth. As for its opening weekend chances, it is on pace for about $35 million over the weekend and I’m predicting $100 million domestically. There’s no way the studio isn’t happy with that.
More...
Sully was the only one of the four wide releases to have previews and the lack of competition paid off, as it opened with $1.35 million. This is more than twice as much as Tom Hanks’ previous fall release, Bridge of Spies, earned last year ($600,000). That film did earn betterreviews than Sully earned, but with a Tomatometer Score of 82% positive, Sully isn’t going to suffer from bad word-of-mouth.
More...
Fall Season starts in lively style this weekend with an impressively wide release for Sully. The Clint Eastwood/Tom Hanks drama will open in 3,525 theaters, the most for a new release since Pete’s Dragon almost a month ago. That film’s $21 million opening will be the minimum benchmark for Sully.
More...
The weekend after the Labor Day long weekend is often the worst weekend of the year. However, this year there two films opening wide that have a real shot at $20 million or more. Sully is Oscar-bait, but it is opening a little too early for that role and its reviews are a little below where they need to be. When the Bough Breaks is a thriller aimed at African-Americans and this time of year has become the perfect time to release such a film. Those two films should earn $50 million combined. Unfortunately, there are two other films coming out this week. The Wild Life is a third-tier animated film, while The Disappointments Room isn’t even opening truly wide. There’s a chance neither of them will reach the top five. The Disappointments Room likely won’t reach the top ten. This weekend last year, the top two films were The Perfect Guy and The Visit, which combined earned just over $50 million at the box office. It should be a really close race in the year-over-year competition.
More...
August continued to pad 2016’s lead over 2015 in the year-over-year comparison. It managed this feat almost entirely due to Suicide Squad, which is on pace to hit $300 million. The next best film was Sausage Party, which might make $100 million, if it gets a push over the top. September won’t be as strong as that. This is no surprise, as the month is one of the biggest dumping grounds on the calendar. That said, studios have been working to make the end of the month a lot more productive and there are a few potential hits. The biggest of these is The Magnificent Seven, which is expected to crack $100 million, maybe even $150 million. Meanwhile, Sully and Storks both have a limited chance at $100 million. Last September, the biggest release of the month was Hotel Transylvania 2 with pulled in $169.70 million. I don’t think The Magnificent Seven will match that, so we might need a surprise $100 million hit for 2016 to come out on top.
More...
It is a really slow week on the top with only a couple of main releases worth being a contender for Pick of the Week: Supergirl: Season 1 and Sweet Bean on DVD. The Nice Guys would also be a contender, but it is only coming out on Video on Demand this week and it is worth waiting for the Blu-ray Combo Pack. With only two real choices, Sweet Bean is my Pick of the Week.
More...
On January 15, 2009, the world witnessed the “Miracle on the Hudson” when Captain “Sully” Sullenberger glided his disabled plane onto the frigid waters of the Hudson River, saving the lives of all 155 aboard. However, even as Sully was being heralded by the public and the media for his unprecedented feat of aviation skill, an investigation was unfolding that threatened to destroy his reputation and his career.
More...
There are several limited releases on this week's list, including three that have a shot at earning a spot in the top ten. However, the best-reviewed releases are among the smaller releases: Tale of Tales and The Meddler included. However, if you don't want to go out, Holidays is good bet on Video on Demand.
More...
Toy Story that Time Forgot is the latest Disney TV special to hit the home market. It is based on the Toy Story franchise and hit TVs last December. Is is worth checking out if you haven't seen it before? Is it worth picking up?
More...
Most of the new releases were not expected to do well at the box office. ... Almost no one saw this coming. We had some near-record bombs this weekend and even the best of the new releases were terrible. This left The Martian in first place; in fact, the top three spots and four of the top five were held by holdovers. The best new release, The Last Witch Hunter, barely cracked the $10 million mark. The overall box office fell 14% from last weekend to $105 million. This was also 9.5% lower than the same weekend last year. Midweek numbers were better this year than last year, so the year-over-year actually improved and 2015 now has a 5.2% lead over 2014 at $8.60 billion to $8.18 billion.
More...
A slightly-softer-than-expected (but still good) opening for Goosebumps will be enough to take the film to the top of the box office chart this weekend, according to studio projections released on Sunday morning. Sony expects the family horror adventure to come in with $23.5 million on opening weekend, which is a solid enough start, and sets the film up for a good run, helped by strong reviews and Halloween coming up in a couple of weeks. The Martian will land in second with a projected $21.5 million as of this morning, a slightly steeper-than-expected 42% decline from last weekend, and a total to date around $144 million. In general, we’re looking at quite a few steep drops from last weekend thanks to an unfavorable comparison with the Columbus Day long weekend and a batch of new releases.
More...
September ended on a record note with the debut of Hotel Transylvania 2. Additionally, there was great depth and 2015's lead over 2014 grew to nearly $500 million. How do things look going forward? The month starts out with The Martian, which should have no trouble becoming the biggest hit of the month and might even top $200 million. On the other hand, no other film is expected to get to $100 million. There's only one or two that will even come close. Fortunately, last October was very similar with one $100 million hit, Gone Girl, while two other films came close, Annabelle and Fury. It looks like it will be up to the depth films from both years to determine which year comes out on top.
More...
After smashing the January weekend record last weekend, American Sniper is enjoying a very solid second-weekend hold. So solid, in fact, that it will also have the third-best January weekend. If it drops less than 35% next weekend, it will share with Avatar the records for the top six January weekends, each movie having topped $42 million three times. Sniper’s expected weekend this time around is $64.365m, according to Warner Bros. Sunday morning projection.
More...
The Terminal came out in 2004, just after Tom Hanks' record-breaking run of seven $100 million hits in a row came to an end. The streak ended with The Ladykillers, but many thought The Terminal would start a new streak. It didn't. Now that it has been ten years since it came out, does it feel like it underperformed at the box office. Or was this never going to be a big hit with moviegoers?
More...
The home market picks up steam this week, sort of. We are starting to get some of the Awards Season hopefuls coming out, which is great news for fans of great movies. However, there's not a lot of depth to go with the award-worthy movies. The two films that were the main contenders for Pick of the Week were Captain Phillips on DVD or Blu-ray Combo Pack and In a World... on DVD or Blu-ray. It was a close decision, but in the end, I went with In a World...More...
Hollywood Foreign Press Association announced their Golden Globe nominations this week, and a clear picture is forming. 12 Years a Slave was again the recipient of the most nominations, but this time it was a tie, as it and American Hustle both grabbed seven nominations. If you look down the list of other multi-nominated films, you will find a number of familiar faces.
More...
Big hits the home market this week with a 25th Anniversary Edition Blu-ray. Or if you want to be snarky, you could call it a 4th Anniversary Edition of the 2009 Blu-ray release. Is there anything new this time around? No. That said, if you didn't grab the Blu-ray the first time around, is the 25th Anniversary Edition worth it?
More...
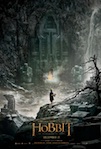
We had some good news and some bad news in November. The bad news is the overall weakness at the box office continued and 2013 lost its lead over 2012. Strong runs by The Hunger Games: Catching Fire and Frozen did help it bounce back in the end, but 2013 is still going to have a tough time topping 2012. Looking forward to December, we find about a dozen wide releases, sort of. There are several films that are opening in limited release that are expected to expand wide by the end of the month, but I'm not sure that will be the case for all of them. The Hobbit: The Desolation of Smaug should be the easy winner this month and if it is a little lucky, it might even top its predecessor at the box office. There is a huge amount of hype surrounding Anchorman 2: The Legend Continues and it could double the first film's box office numbers. On the other hand, those two films might be the only two December wide releases to reach $100 million. There are a few that have the potential to get to the century mark, if they are big players during Awards Season. Obviously some of the films coming out this month will win awards, but there's already a lot of competition in theaters before the month begins. There were three $100 million movies last December, led by The Hobbit: An Unexpected Journey, so while it could be close, it looks like December will lose in the year-over-year comparison. This is really bad news, as 2013 can't afford to go out on a losing streak if it wants to top 2012.
More...
On Tuesday we launched The Numbers Bankability Index, a new service to help assess the value that different people bring to the industry, from actors and actresses to directors, screenwriters, producers, and anyone else involved in the creative process of making a movie. In this article, I'll look more deeply into how the Index is compiled, and how we use the tools behind it to analyze questions about people in movies.
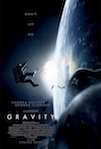
Both Gravity and Captain Phillips topped expectations, which is a reason to celebrate. However, it's practically the only reason to celebrate. Cloudy with a Chance of Meatballs 2 did well, but from that point on, the box office was a disaster. Overall, the total box office was $116 million, which was down 8% from last week. Compared to last year, the box office was down by 10%. How can this year's top film earn more than twice as much as last year's number one film, but still lose out overall? Last year, the fourth place film was Hotel Transylvania, which earned $17.24 million. This year the fourth place film was Machete Kills, which earned just $3.84 million. The depth this year is simply terrible. Year-to-date, 2013 is still ahead of 2012, but by less than 1% at $8.21 billion to $8.15 billion.
More...
There are two wide releases this week: Captain Phillips and Machete Kills. The former is a potential Awards Season player, while the latter is definitely not. Unfortunately, neither seems likely to challenge Gravity for top spot at the box office this weekend. Captain Phillips should come in a solid second place, while Machete Kills will try not to under-perform when compared to Runner Runner's opening from last weekend. Gravity could help 2013 top last year's box office, which was led by Taken 2 in its second weekend of release. The best new release was Argo, but it opened with less than $20 million and Captain Phillips should top that. However, last year had much better depth and might prove to be too much for 2013 to overcome.
More...
October is an awkward month. It sits between the dumping ground that is September and November, the unofficial start of Awards Season / holiday blockbuster season. For the most part, September was stronger than average for the month and there's reason to be optimistic going forward. After all, box office success tends to feed on itself, as does box office struggles. That said, there are not a lot of sure hits over the coming four weeks. Of the nine or ten films opening wide this month, only Gravity has a better than 50/50 chance at $100 million. Captain Phillips could have a shot at the century mark, but only if it becomes a serious Awards Season player. Its early reviews suggest that could be a possibility. Last October, there were two films to reach the $100 million mark, Taken 2 and Argo. On the other hand, pretty much everything else that opened that month crashed and burned. While this October doesn't have as strong a top end, it will hopefully have much better depth.
More...
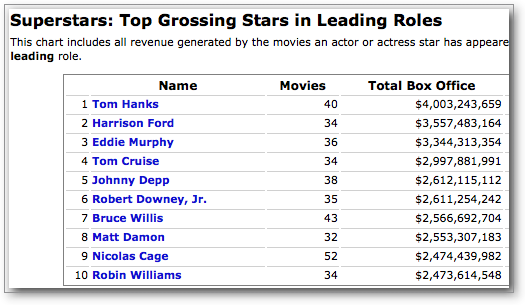
Top-grossing actors and actresses in leading roles
Over the past two or so years, we've been working on one of the biggest projects we've ever undertaken: building out our database of acting and technical credits to include complete information on every acting role and significant technical credit for movies for which we have box office information. While work on this vast task continues (and will, of course, continue as long as films are being made), we have enough coverage of the industry now to start doing some serious analysis. Over the next month or two, I'll be looking at some of the things we've found and we'll be rolling out new features at The Numbers that take advantage of the dataset. This week, I'll look into how we are categorizing acting roles, and discuss the first charts in our new People Records section.
More...
Another typical summer week on the home market. There are a few first-run releases, but nothing that is a blockbuster. There are more TV on DVD releases, including a couple that were contenders for Pick of the Week. This includes Burn Notice: Season Six, but the screener is late, so I'm holding off. Enter the Dragon gets an Anniversary Edition Blu-ray and it is a contender. However, in the end I went with The Newsroom: The Complete First Season on Blu-ray Combo Pack.
More...
Schindler's List came out 20 years ago and immediately earned near universal acclaim and went on to become the big winner at the 1994 Oscars taking home seven awards out of the twelve it was nominated for. This week it makes its Blu-ray debut. Does it still stand up 20 years later? And is the Blu-ray worthy of the film?
More...
Catch Me If You Can opened on Christmas day 2002, and while it was never able to reach top spot on the box office chart (a little film called Lord of the Rings: The Two Towers was blocking it) it did become a huge hit. Ten year later, it is coming out on Blu-ray. Has the film aged well? Is the Blu-ray worth the upgrade?
More...
2012 continues its downward path. After a record-breaking spring, thanks to The Hunger Games, and a record-breaking start to the summer, thanks to The Avengers, the box office hasn't been able to maintain any real momentum. For most of the month, September was no better than August and now the year-over-year gains are just a little more than inflation. October will need to improve or 2012 will be in real trouble. Unfortunately, that might be tough. There's not a single film coming out in October that looks like it will be a guaranteed $100 million hit and there are only two films with a realistic chance, Taken 2 and Paranormal Activity 4. (There's also Cloud Atlas, which is a wild card. That movie could bomb or be the biggest hit of the month and I wouldn't be surprised either way.) There is a chance all three will get to the century mark, but there's a better chance none of them will. Last October, two films cracked $100 million: Paranormal Activity 3 and Puss in Boots, with the latter nearly reaching $150 million. I don't see any film coming close to matching that figure. On the other hand, last year there were six films that one could accurately describe as bombs. So while 2012 is weaker at the top, it could have better depth than 2011 did. Let's hope so, because we can't afford more bad news.
More...
All Acting Credits
Register with The Numbers for free to customize this chart.


-1-News.jpg)
-1-News.jpg)
-1-News.jpg)
-1-News.jpg)
-1-News.jpg)
-(2019)-1-News.jpg)
-3-News.jpg)
-1-News.jpg)

-4-News.jpg)

-3-News.jpg)
-2-News.jpg)

-5-News.jpg)
-2-News.jpg)


-1-News.jpg)
-1-News.jpg)


