


-1-News.jpg)
Synopsis
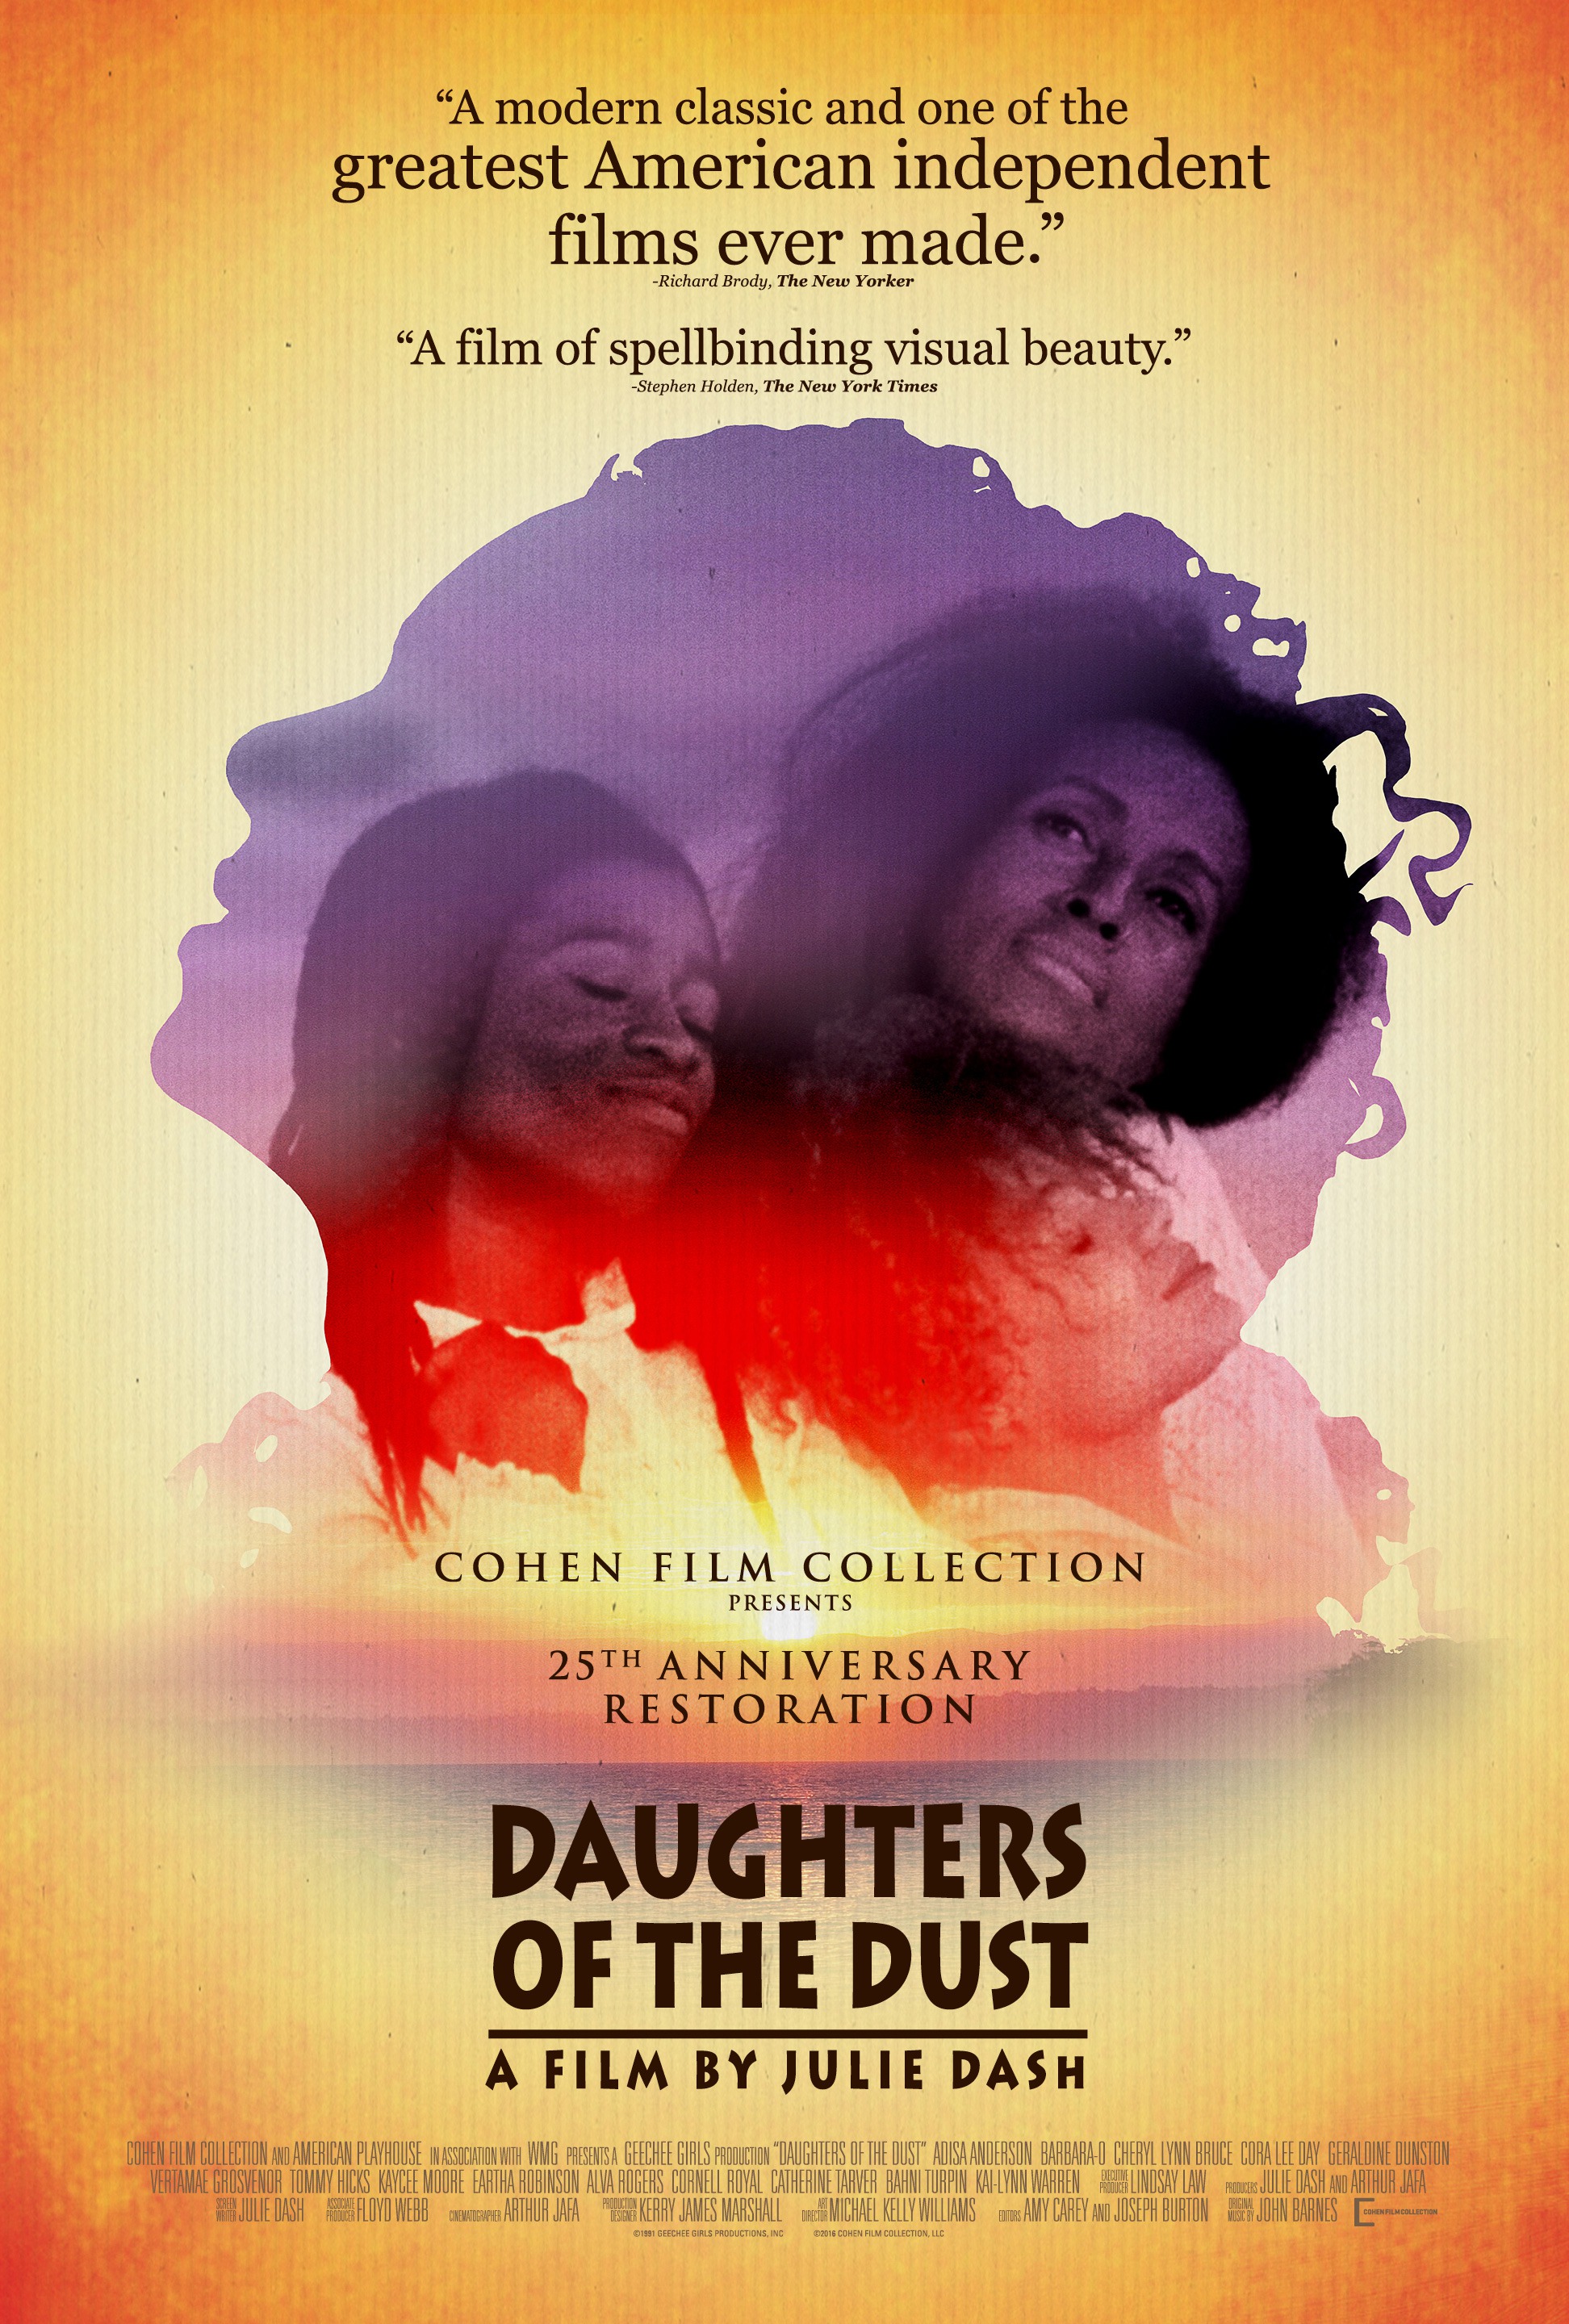
At the dawn of the 20th century, a multi-generational family in the Gullah community on the Sea Islands off of South Carolina — former West African slaves who adopted many of their ancestors’ Yoruba traditions — struggle to maintain their cultural heritage and folklore while contemplating a migration to the mainland, even further from their roots.
Metrics
| Opening Weekend: | $4,624 (0.3% of total gross) |
| Legs: | 21.35 (domestic box office/biggest weekend) |
| Domestic Share: | 99.6% (domestic box office/worldwide) |
| Theater counts: | 1 opening theaters/19 max. theaters, 16.9 weeks average run per theater |
| Infl. Adj. Dom. BO | $4,337,700 |
Latest Ranking on Cumulative Box Office Lists
| Record | Rank | Amount |
|---|---|---|
| All Time Domestic Box Office (Rank 8,101-8,200) | 8,180 | $1,701,575 |
| All Time International Box Office (Rank 25,401-25,500) | 25,408 | $6,299 |
| All Time Worldwide Box Office (Rank 13,501-13,600) | 13,517 | $1,707,874 |
See the Box Office tab (Domestic) and International tab (International and Worldwide) for more Cumulative Box Office Records.
Watch Now On
| Amazon VOD: | Amazon |
| Vudu: | Vudu |
Movie Details
| Domestic Releases: | January 3rd, 1992 (Limited) by Kino International November 18th, 2016 (Limited) by Cohen Media Group, released as Daughters of the Dust (Re-Issue) |
| International Releases: | June 2nd, 2017 (Limited), released as Daughters of the Dust (Re: 2016) (United Kingdom)
September 17th, 2023 (Limited) (Australia) |
| Video Release: | April 11th, 2017 by Sony Pictures Home Entertainment, released as Daughters of the Dust (Re-Issue) |
| MPAA Rating: | Not Rated |
| Running Time: | 112 minutes |
| Comparisons: | vs. Capote Create your own comparison chart… |
| Keywords: | Slavery, 1900s, African Americans |
| Source: | Original Screenplay |
| Genre: | Drama |
| Production Method: | Live Action |
| Creative Type: | Historical Fiction |
| Production/Financing Companies: | Cohen Media Group, American Playhouse, WMG, Geechee Girls |
| Production Countries: | United Kingdom, United States |
| Languages: | English |
Ranking on other Records and Milestones
| Record | Rank | Amount | Chart Date | Days In Release |
|---|---|---|---|---|
| Theater Average 13th Weekend | 57 | $5,265 | Mar 27, 1992 | 87 |
| Theater Average 12th Weekend | 45 | $6,108 | Mar 20, 1992 | 80 |
| Theater Average 11th Weekend | 50 | $6,899 | Mar 13, 1992 | 73 |
| Theater Average 10th Weekend | 30 | $9,034 | Mar 6, 1992 | 66 |
| Theater Average 9th Weekend | 14 | $14,440 | Feb 28, 1992 | 59 |
| Theater Average 8th Weekend | 19 | $12,319 | Feb 21, 1992 | 52 |
| Theater Average 7th Weekend | 7 | $23,201 | Feb 14, 1992 | 45 |
| Theater Average 6th Weekend | 23 | $17,229 | Feb 7, 1992 | 38 |
| Theater Average 5th Weekend | 78 | $11,283 | Jan 31, 1992 | 31 |
| Theater Average 4th Weekend | 85 | $14,357 | Jan 24, 1992 | 24 |
| Theater Average 3rd Weekend | 100 | $18,185 | Jan 17, 1992 | 17 |