October 10th, 2013
There was only one new release to chart on the week of July 28th, 2013 edition of the Blu-ray sales chart and it only managed fourth place. This left 42 in first place with 109,000 units / $2.67 million for the week giving it two-week totals of 336,000 units / $7.89 million.
More...
October 3rd, 2013
The Blu-ray sales chart for the week of July 21st, 2013 had a lot of new releases on top with three of them opening in the top three spots. The best was 42 with 253,000 units / $5.82 million for an opening week Blu-ray share of 34%. That's actually really good for a drama.
More...
October 3rd, 2013
New releases led the way on the July 21st, 2013 edition of the DVD sales chart with new releases taking the top three spots. First place went to 42 with 489,000 units / $7.33 million. This is a good start and after a better than expected domestic run, it is well on its way to profitability.
More...
September 23rd, 2013
There were a lot of new releases for the week of July 14th, 2013, but none of them were monster releases. In fact, The Host was the only film to sell more than 100,000 Blu-rays. Because of this, it should come as no surprise that the overall Blu-ray market was soft. Overall, 646,000 units were sold and $13.93 million in revenue was generated. This is a substantial increase from last week, up 19% in terms of units and 15% in terms of revenue. It was more or less flat compared last year, down 2% in terms of units, but up 9% in terms of revenue. The overall Blu-ray share rose to 24% in terms of units and 35% in terms of revenue. That will rise more when the summer blockbusters start coming out.
More...
July 14th, 2013
It's not a bad week on the home market with a couple first-run releases that are worth picking up. 42 earned great reviews, but the DVD and the Blu-ray Combo Pack don't have enough extras to lift to to the Pick of the Week contender. Evil Dead does have a lot better extras on the DVD and Blu-ray Combo Pack, but the reviews were only good and not great. This leaves Regular Show: Season 1 & Season 2 on DVD or Blu-ray as the Pick of the Week. If you like Adventure Time or Gravity Falls, then you will likely enjoy this show as well. One final note, Orphan Black: Season One on DVD or Blu-ray is absolutely worth picking up and is worthy of Puck of the Week, for best Canadian released.
More...
May 15th, 2013
Iron Man 3 earned first place for the third weekend in a row, this time pulling in $89.3 million on 9,921 screens in 55 markets for totals of $664.4 million internationally and $949.3 million worldwide. At this pace, the film will have no trouble getting to $1 billion this coming weekend, while it should enter the top ten of all time by the end of the weekend. The film's single best market of the weekend was China, where it added $32.7 million over the week to its running tally, which now sits at $97.2 million.
More...
April 15th, 2013
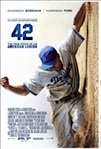
42 earned an easy win at the box office, in part due to a better than expected performance, but also in part due to really weak competition. It did manage 16th place on the list of April openings and 20th best April weekend overall, which is worth celebrating. Scary Movie 5, on the other hand, struggled and only a low production budget will save it or the franchise. The overall box office was down 13% from last week to $117 million; however, that's 2% higher than the same weekend last year, so there's another reason to celebrate. Year-to-date, 2013 is still taking a beating and is off 2012's pace by 11% at $2.62 billion to $2.95 billion.
More...
April 12th, 2013
It's a two-way race for top spot at the box office this weekend with both Scary Movie 5 and 42. Just last week it looked like Scary Movie 5 would win, but as 42's box office prospects have risen, its have fallen. It is not a sure thing that 42 will win and it should be a close race, but it does have a slight edge. This weekend last year was led by... The Hunger Games ... for the fourth week in a row. It's the last time I have to say that. There were two other new releases that made an impact at the box office: The Three Stooges and The Cabin in the Woods. I think the new releases this year will be better than last year, but The Hunger Games will be the tie-breaker.
More...
April 10th, 2013
The winners of our Dead and Evil contest were determined and they are...
More...
April 8th, 2013
Evil Dead led the way at the box office matching predictions (nearly) perfectly. It fell just a little short of the predicted $26 million, and it was the only film in the top five to miss expectations. This helped the overall box office hold up better than expected. Granted, it did fall 8.7% from last weekend to $134 million, but that was 8.8% higher than the same weekend last year. Year-to-date, 2013 is still taking a beating down 11% at $2.47 billion to $2.79 million, but this win is still helpful. If 2013 can string together a few more wins, then the start of summer and The Avengers won't sting quite as bad.
More...
April 4th, 2013
There are no truly absolutely new releases this weekend. That's not to say there's nothing sort of new to check out. The Evil Dead remake is coming out and its buzz is growing louder than I was expecting. It could be a surprisingly strong release. Also, Jurassic Park 3D re-release is coming out, and while its buzz is much lower, it should still earn as much as it cost to convert into 3D during its opening weekend, or at least come close. This weekend last year, American Reunion debuted with disappointing numbers earning second place while Titanic's 3D re-release did relatively well placing third. I think the combined opening weekend of the two new releases this year will top those from last year. Unfortunately, last year The Hunger Games led the way and that will be enough to keep 2013 behind 2012 in the year-over-year comparison for yet another weekend.
More...
April 1st, 2013
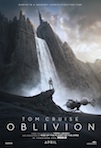
March is over and while it is a little too soon to tell where a few films will end their box office runs, it is clear Oz The Great and Powerful won the month. Some films beat expectations to become midlevel hits, like The Call, but it wasn't a great month at the box office, especially compared to last year. This month, there are only seven wide releases spread over four weeks. Only one of those films, Oblivion, has a shot at being anything more than a midlevel hit. None of the other six releases look like they will come close to $100 million, but none of them look like obvious bombs either. (Although I do have my worries when it comes to Scary Movie 5.) Last April was even weaker with no film earning $100 million, although Think Like a Man did come relatively close. We might actually see growth on the year-over-year comparison. We'd better, because 2013 is behind 2012's pace by a huge margin at the moment and things will get worse when May arrives.
More...
March 29th, 2013
Next weekend is the start of a new month, but there's only one truly new release: Evil Dead. Jurassic Park is getting a 3D re-release and some think it will be the big hit of the weekend. I'm not buying it, as the 3D re-releases seems to fallen out of favor. Maybe I'm wrong, but I'm going with Evil Dead as the target film for this week's box office prediction contest. In order to win, one must simply predict the opening weekend box office number for Evil Dead.
Whoever comes the closest to predicting the film's opening 3-day weekend box office (Friday to Sunday), without going over, will win a copy of The Borgias: The Second Season on Blu-ray.
Meanwhile, whoever comes the closest to predicting the film's opening 3-day weekend box office (Friday to Sunday), without going under, will win a copy of Triad Wars on DVD.
Entries must be received by 10 a.m., Pacific Time on Friday to be eligible, so don't delay!
More...