March 4th, 2018

It’s Oscar night and we will be live blogging the show. We will announce the winners and have our reactions as they happen, while keeping track of how our readers did in predicting the outcomes.
More...
March 4th, 2018

It’s Oscar night and we will be live blogging the show. Before that, let’s take a last look at the nominations with a few annotations. Nominees in Italics are those that have received the most votes from our readers so far in our Oscar contest (which is open to new entries until noon, Pacific, today—enter now!). Bold films are those films I think will win. Meanwhile, those that are Underlined are those I want to win. Not all categories have underlined nominees, because not all categories have someone I’m cheering for, or because there are two nominees I couldn’t pick between. For example, I will be happy no matter who wins Best Supporting Actress. One last note: The contest is still going and the leading for Best Picture Switched from The Shape of Water to Three Billboards Outside Ebbing, Missouri to tied over the time I was writing this story. This is the closest I’ve ever seen it. Guessing the best picture correctly will go a long way to winning.
More...
February 19th, 2018

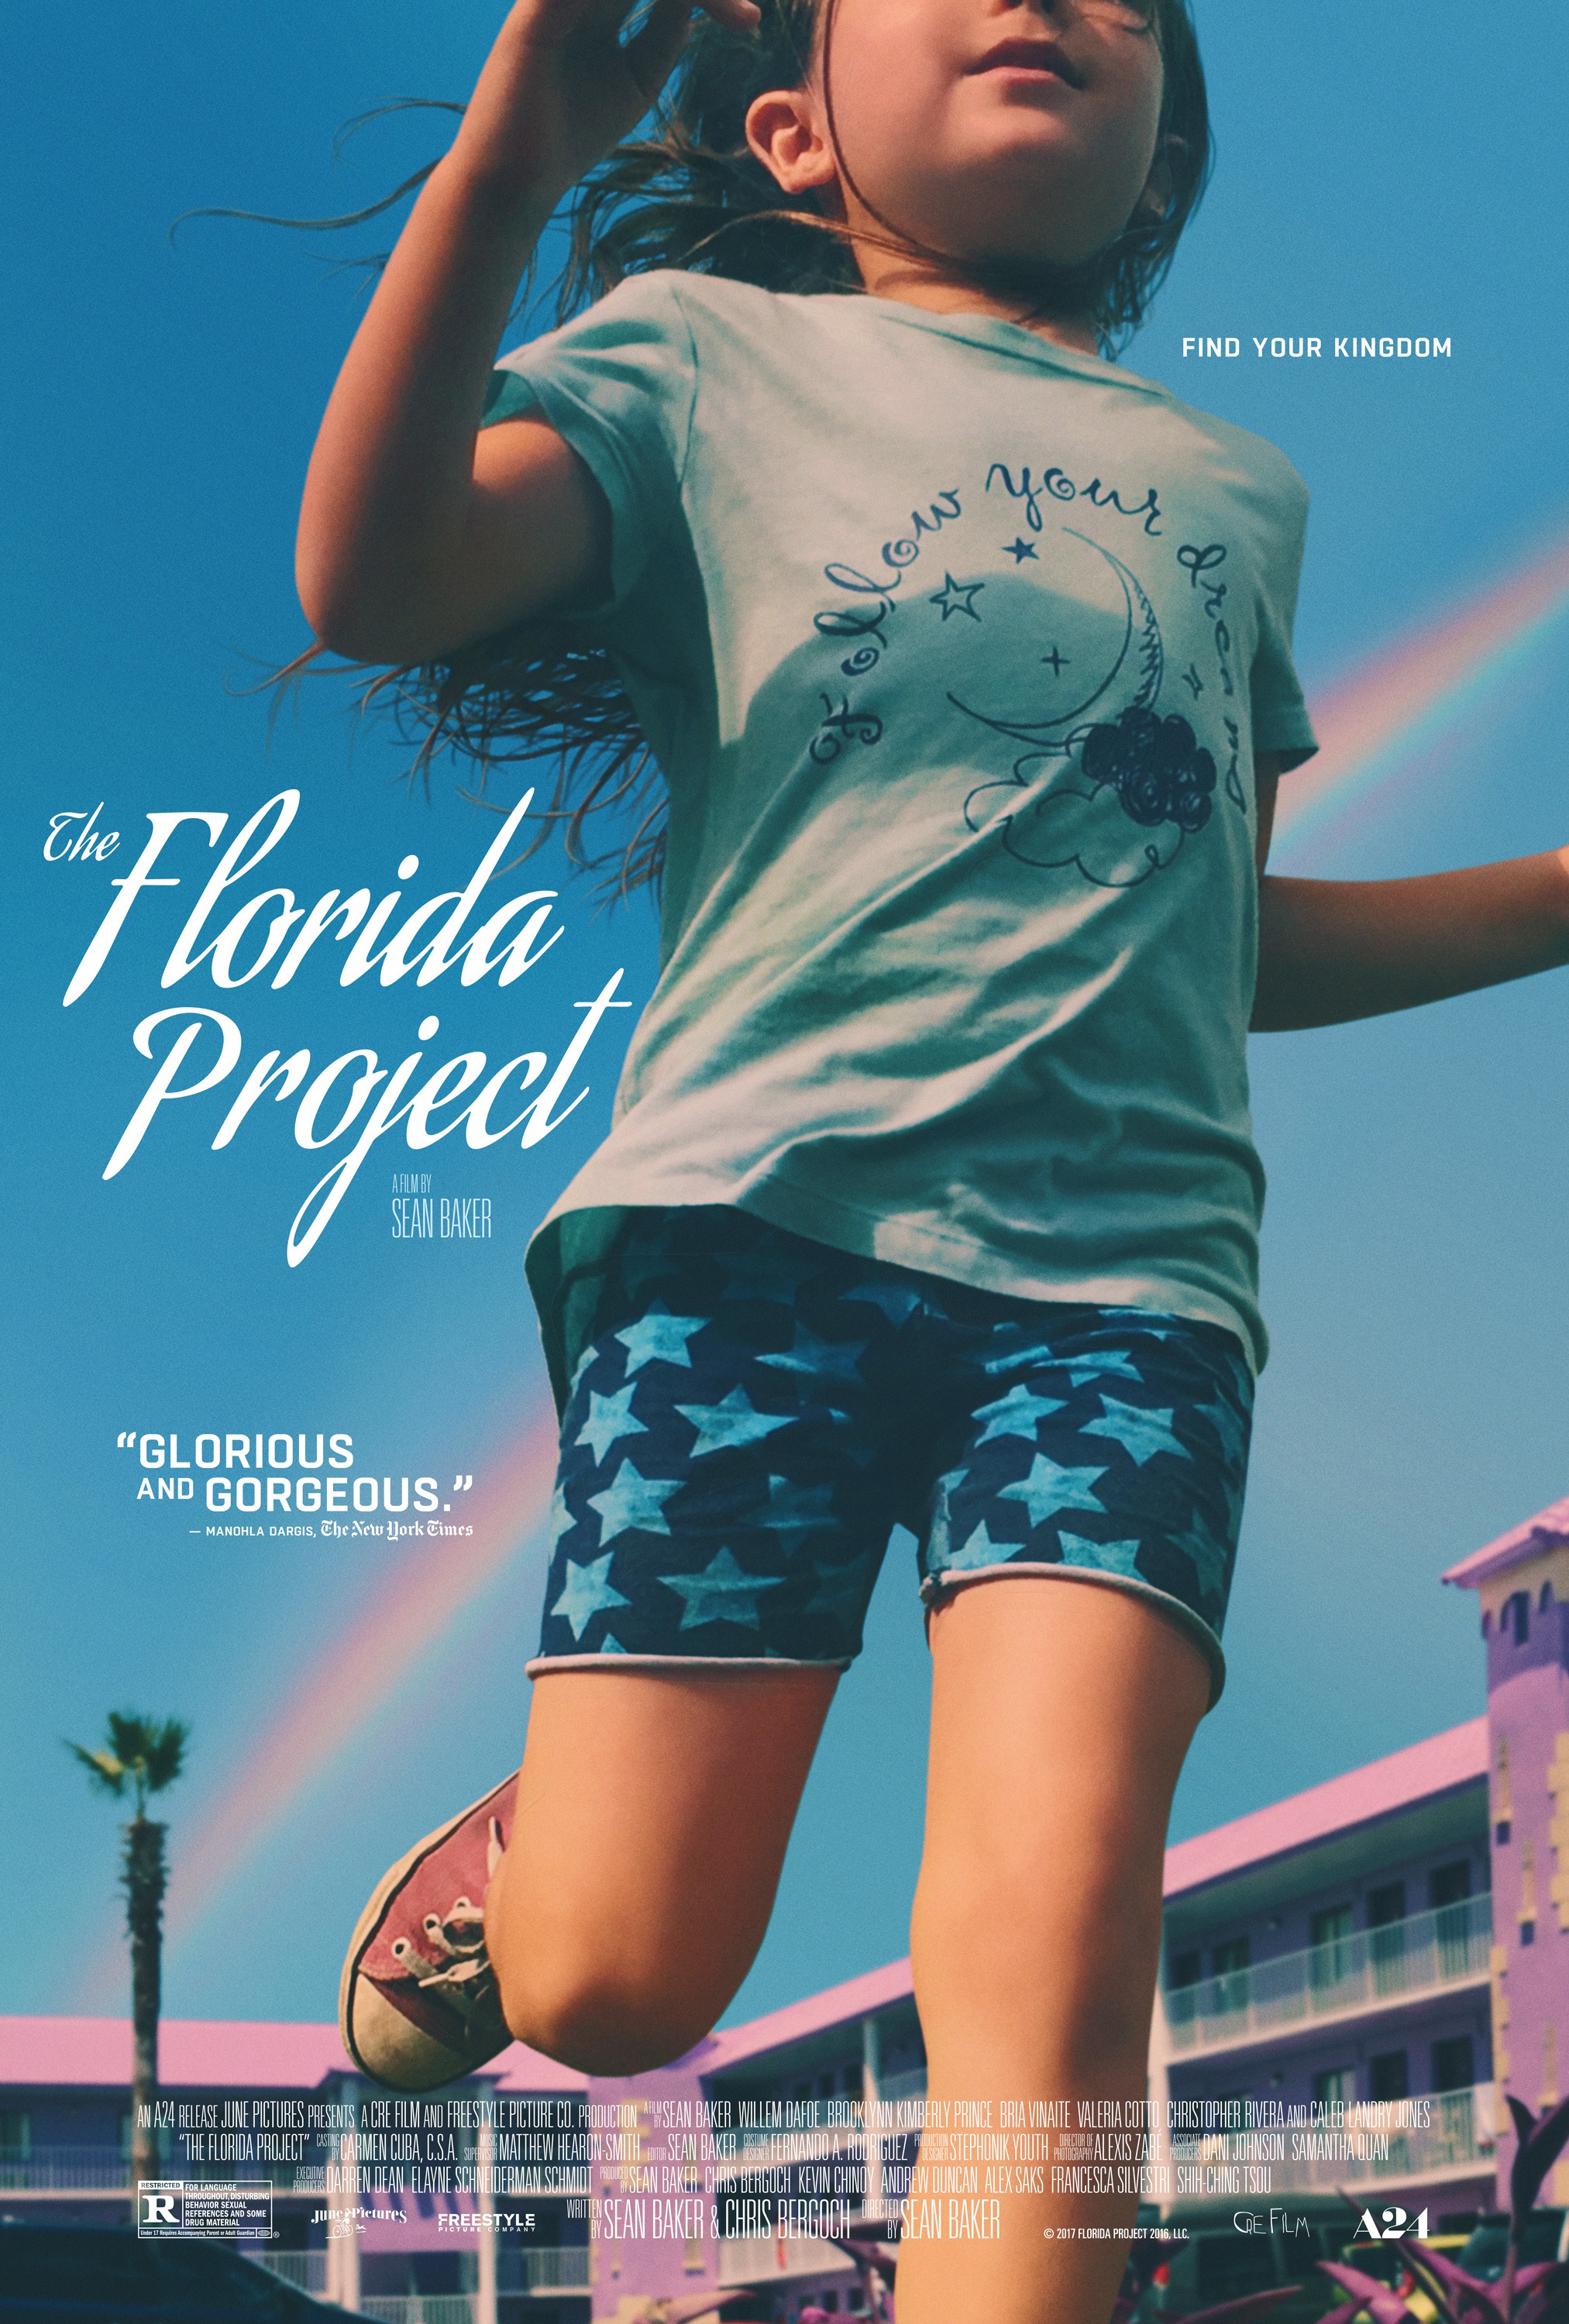
It’s another slow week; however, I prefer to think of it as the calm before the storm, as there are several blockbusters and Oscar contenders coming out over the next few weeks. That’s not to say there are no big hits or Oscar contenders on this week’s list. The Florida Project and Loving Vincent are both up for an Oscar, while there are some massive hits coming out on VOD, like Thor: Ragnarok. As for the Pick of the Week, it was an easy choice: The Florida Project on Blu-ray.
More...
January 31st, 2018

This is one of the worse times of year for the home market. Until we start getting the holiday blockbusters landing on DVD / Blu-ray, there’s not much to talk about. That’s not to say there are no good releases, as God’s Own Country, The Square, and Steven Universe: Season One are all easily worth picking up. There are just no big releases. For example, the Pick of the Week goes to Professor Marston & The Wonder Women on Blu-ray, which was sadly ignored by moviegoers when it first hit theaters.
More...
January 23rd, 2018

The Oscar nominations were announced starting at just after 5 am Pacific time. They do this every year and no one has been able to adequately explain why to me. At least there were some interesting results this year. The Shape of Water led the way with 13 nominations, which is one below the current record and nearly as many as the next two films combined. Overall, there were seventeen films that earned two or more nominations.
More...
January 11th, 2018

The BAFTA nominations were announced and this time The Shape of Water led the way with 12 nominations. The same films appear on many of the lists of nominees, but so far no one film has come to dominate the list. This makes it interesting, to say the least. There’s a good chance no one film will win the majority of prestige awards and that multiple films will have lots of reason to celebrate on February 18th when the awards are handed out.
More...
December 13th, 2017
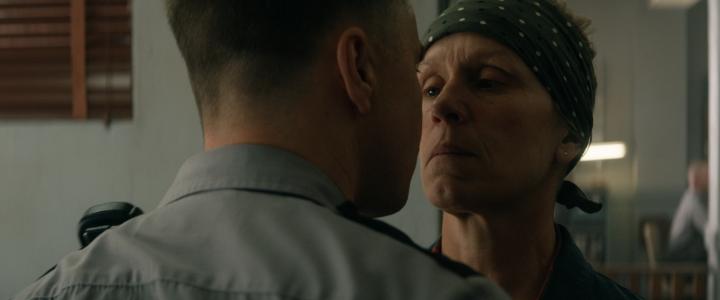
The Screen Actors Guild were the third group to announce their nominations for this awards season. So far there have been three different films earning the most nominations. Three Billboards Outside Ebbing, Missouri picked up four nominations, which is extra impressive, as there are only six theatrical categories.
More...
December 12th, 2017
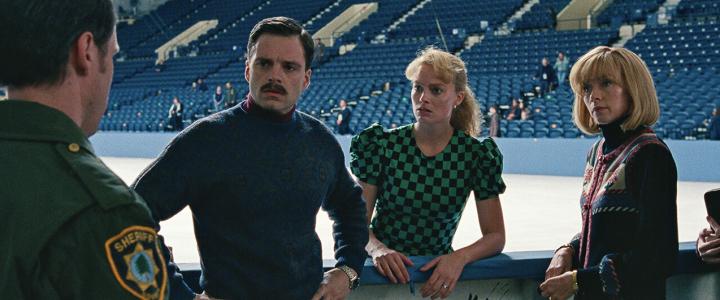
There was another Oscar contender on top of the theater average chart this weekend, as I, Tonya earned an average of $66,039 in four theaters. Call Me by Your Name was the next best film with an average of $31,761 in nine theaters. The film isn’t expanding as fast as one would expect, given its theater average, but this could be because the studio doesn’t think it has mainstream appeal. The Shape of Water was close behind with an average of $27,843 in 41 theaters and it has already earned some measure of mainstream success. The final film in the $10,000 club was Darkest Hour with an average of $13,989 in 53 theaters.
More...
December 11th, 2017

The Golden Globes nominations are the second major Awards Season set to come out. Sort of. (WGA announced the nominations for TV, radio, etc., but not their theatrical nods.) It is still very early in the year, so it is hard to say if there are any real snubs, or if there are any real favorites. The Shape of Water led the way with seven nominations, while The Post and Three Billboards Outside Ebbing, Missouri were right behind with six a piece.
More...
November 22nd, 2017

The Independent Spirit Awards nominations were announced yesterday and thus the 2017 Awards Season begins. The movie with the most nominations is Call Me by Your Name, which opens on Friday. This is amazingly good timing. It’s not the only film that should get a financial boost.
More...
November 21st, 2017
-8-News.jpg)
Justice League topped the theater average chart with $23,165 in just over 4,000 theaters. This is in the top ten best theater averages for any wide release that has come out this year, but it is about 25% lower than it needed to be. Last week’s winner, Three Billboards Outside Ebbing Missouri was pushed into second place with an average of $20,796 in 53 theaters. Its strong hold plus its early success during Awards Season should help it stick around in theaters for a long time. Roman J. Israel, Esq was next with an average of $15,500 in four theaters. This would be a good start for a limited release, but it is scheduled to expand wide on Wednesday, so I’m not sure it is good enough. Finally, Lady Bird rounded out the $10,000 club with an average of $10,573 in 238 theaters. It has already earned a significant measure of mainstream success and it still has room to grow.
More...
November 14th, 2017
This week’s winner on the theater average chart was Three Billboards Outside Ebbing Missouri, opening with an average of $80,542 in four theaters. This puts it in third place for the year, behind Lady Bird ($91,109) and The Big Sick ($84,315). Speaking of Lady Bird, the film earned an average $32,426 in 37 theaters, putting it in the top ten over the weekend. Bill Nye Science Guy is traveling the country and this week it was playing in one theater in Los Angeles earning $14,350. Thor: Ragnarok was right behind with an average of $13,990. The final film in the $10,000 club was Thelma, which earned $10,841 in one theater.
More...
November 12th, 2017

Thor: Ragnarok maintains a firm hold on top spot at the domestic and international box office this weekend, with a respectable decline of 54% at home taking it to $56.6 million for the weekend and $211.6 million to date. With another $75.9 million internationally, for a total of $438.5 million overseas,
Ragnarok will pass $650 million worldwide today. That makes it the most successful Thor film already, and it seems like it should retain decent traction into the holidays, even with Justice League coming out next weekend.
More...
November 1st, 2017
-1-News.jpg)
The Square was the only film in the $10,000 club this past weekend. The latest from Ruben Ostlund earned an average of $18,558 in four theaters. This is a better opening than his last film, Force Majeure, which earned more than $1 million domestically. Hopefully this one will do the same.
More...
October 25th, 2017

It was a good weekend with three films earning more than $10,000 on the theater chart, led by The Killing of a Sacred Deer, with an average of $28,780 in four theaters. Its Tomatometer Score is merely good, but its average is even better at 8 out of 10. An average score of 8 out of 10 is close to award-worthy. Meanwhile, Jane did even better with an average of $19,449 in three theaters, which is amazing for a documentary. Its reviews remain 100% positive and the average critic simply loves the movie and it could be an Oscar winner. Wonderstruck rounded out the $10,000 club with an average of $16,471 in four theaters. Its reviews are merely good, so its might have trouble growing. That said, it is more accessible and mainstream than most other limited releases, so that could help.
More...
October 18th, 2017
-1-News.jpg)
Human Flow earned first place on the theater average chart with an average of $15,226 in three theaters. The only other film in the $10,000 club was last week’s winner, The Florida Project, with an average of $11,156 in 33 theaters.
More...
October 15th, 2017

This weekend will be another winner for horror movies, with Happy Death Day powering into first place with a projected $26.5 million, according to Universal’s Sunday morning numbers. That puts it miles ahead of Blade Runner 2049, which failed to broaden its audience this weekend, and is down 54% to $15.1 million, for $60.6 million in total.
More...
October 11th, 2017
The Florida Project dominated the theater average chart earning over $150,000 in four theaters for an average of $39,208. This is easily the best new release of the week.
More...
October 8th, 2017

After It smashed the September weekend record a month ago, further proving that films can open huge at any time of the year, prospects looked great for the long-awaited sequel to Blade Runner. Its trailers had created positive buzz, the early reviews were very favorable, and there was little by way of competition. The bar it needed to cross to break the record, Gravity’s $55.8 million wasn’t even all that high. But something went wrong on the way to the multiplex.
More...
October 7th, 2017

I was bullish about Blade Runner 2049’s chances for a number of reasons. It was setting October records for pre-sales on a number of sites. Its reviews were over 90% positive. Its previews were a little stronger than expected, so everything was looking up. Then Friday happened. The film only pulled in $12.7 million on Friday, which is well below expectations. This is not a case of critics loved it, but the audiences didn’t, as it scored an A minus from CinemaScore. Perhaps not enough of the target audience even remembers the original Blade Runner and that’s why this movie is struggling. A lot of people thought it had a shot at $50 million this weekend but now $35 million is likely out of reach. $33 million is more likely at this point.
More...
October 6th, 2017
-1-News.jpg)
It is a very busy week for limited releases with over 30 films coming out this week. Needless to say we’ve had to be a little callous, culling the list to a more manageable number. We are still left with a number of films that have a shot at finding a receptive audience. Some of these are like Better Watch Out, which will struggle in theaters, but very likely do well on Video on Demand. Others, like The Florida Project, could see its strong reviews turn to Awards Season success and that will be a boon to its financial success.
More...
October 3rd, 2017
Drama starring Helen Mirren and Donald Sutherland opens January 19, 2018 ... Full Movie Details.
A runaway couple goes on an unforgettable journey in the faithful old RV they call The Leisure Seeker, traveling from Boston to The Ernest Hemingway Home in Key West. They recapture their passion for life and their love for each other on a road trip that provides revelation and surprise right up to the very end.
More...
October 2nd, 2017
Drama starring Willem Dafoe opens October 6 ... Full Movie Details.
More...