April 25th, 2018
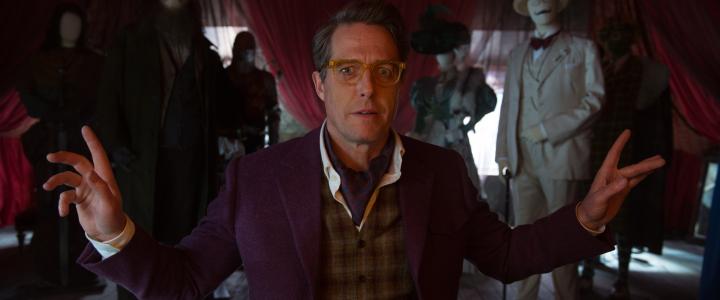
Paddington 2 is the biggest release of the week and clearly at least one of the best. However, it isn’t the only film that’s a Pick of the Week contender. Bombshell: The Hedy Lamarr Story, Miss Kobayashi’s Dragon Maid, and others were all in contention for that honor. In the end, the Paddington 2 Blu-ray Combo Pack earned that title.
More...
April 10th, 2018

The last box office hit of 2017, The Greatest Showman, hits the home market this week. There are also a couple of Awards Season contenders, but for the most part, it is another slow week. Phantom Thread on Blu-ray is the clear Pick of the Week winner. Meanwhile, Molly’s Game on Blu-ray Combo Pack is the only real competition.
More...
January 30th, 2018

Maze Runner: The Death Cure beat expectations by a little bit with $24.17 million. In fact, every film in the top five this this weekend, except one, topped expectations, including the other new release, Hostiles. This helped the overall box office rise 2.6% from last week. It did fall 0.8% from last year, but 2018 is still ahead of 2017 by $18 million or 2.1% at $908 million to $890 million.
More...
January 23rd, 2018

Nearly every film we talked about in our predictions beat expectations over the weekend. This includes Jumanji: Welcome to the Jungle, which earned first place with $19.51 million. All three wide releases did better than expected, with 12 Strong leading the way with $15.82 million. The overall box office still fell 15% from last weekend to $135 million. A 15% drop-off for a post-holiday weekend isn’t bad. Compared to this weekend last year, 2018 was down by 7.0%, which isn’t good, but it could have been much worse. Year-to-date, 2018 still has a small lead of 2.9% or $20 million at $725 million to $704 million. Granted, it is still way too early for this to matter, but an early lead means you won’t need to fight back late in the year like we did last year.
More...
January 21st, 2018
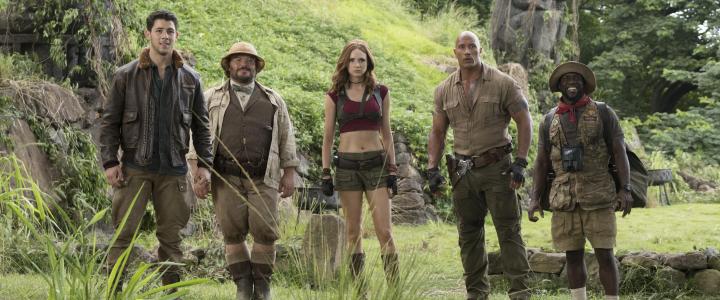
Jumanji will win at the box office for a third straight weekend, according to studio estimates released on Sunday morning. Its weekend total of about $20.04 million is down just 29% from its MLK Holiday numbers, in spite of losing over 100 theaters (its theater average is off just 26%). With $317 million to date, it is now Sony’s most successful non-Spider-Man movie at the domestic box office, not accounting for ticket price inflation. Inflation-adjusted, it’s at number 8 for the studio, and should end up their fifth-best ticket seller ever.
Jumanji’s strength is far from the only good news this weekend.
More...
January 20th, 2018

As expected, 12 Strong opened in first place on Friday. Technically it tied for first place according to the estimates. It did do a little bit better than expected, earning $5.66 million, which puts it on pace for about $15 million over the weekend. Its reviews got a little bit better since Thursday and are now 56% positive, while it is earning an A from CinemaScore. Clearly this movie is connecting with its target audience. This is great news for Warner Bros., as they only spent $35 million making the movie and likely a little under that advertising it. Strong legs would be a good omen for strong home market sales. On the other hand, I don’t think its going to find an audience internationally.
More...
January 19th, 2018
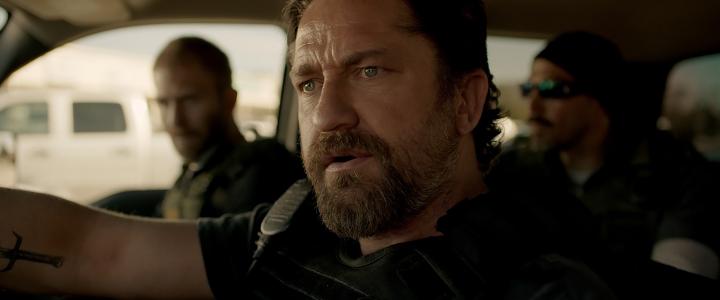
Den of Thieves surprised analysts with $950,000 on Thursday, putting it just ahead of 12 Strong, which managed $900,000. However, 12 Strong does have better reviews and a more mature target demographic, so it should have better legs and still has a better shot at the box office overall. Den of Thieves will beat our prediction and will likely earn a spot in the top five. We will have a better idea where it will end up this time tomorrow when Friday’s numbers are in.
More...
January 18th, 2018

The post-holiday weekend is rarely a good week to release a movie and none of the three new releases are expected to be box office successes. 12 Strong is the biggest release and it is also earning the best reviews, although its Tomatometer Score is just 50% positive. Den of Thieves isn’t opening as wide, while its reviews are not as good. It also shares its target audience with 12 Strong, which will hurt its box office chances even more. Finally there’s Forever My Girl, which is barely opening semi-wide and will likely miss the top ten. This weekend last year, Split had a shockingly big opening. In fact, the second place film, xXx: Return of Xander Cage, opened with just over $20 million, which is more than any film is expected to earn this weekend. 2018’s mini-winning streak is about to come to a painful end.
More...
January 11th, 2018
Romantic drama starring Alex Roe and Jessica Rothe opens January 19 ... Full Movie Details.
Country music super-star Liam Page left his bride, Josie, at the altar to choose fame and fortune instead. However, Liam never got over Josie, his one true love, nor did he ever forget his Southern roots in the small community where he was born and raised. When he unexpectedly returns to his hometown for the funeral of his high school best friend, Liam is suddenly faced with the consequences of all that he left behind.
More...
January 1st, 2018

2017 wasn’t a good year. It started out well and ended on a high note, but the summer was a disaster and that proved to be too much for the rest of the year to overcome. Fortunately, The Last Jedi and Jumanji: Welcome to the Jungle are still doing very well and will help January get off to a fast start. Unfortunately, the biggest new release of January is Paddington 2 and it isn’t expected to match its predecessor at the box office; it certainly won’t top $100 million domestically. It is unlikely any of the Oscar contenders will hit the century mark in January either. This is really bad news, as last January, we had a new release, Split and an Oscar contender, Hidden Figures, which both topped that milestone with ease. 2018 should get off to a faster start in the first two weeks, but overall, this month will end with a loss.
More...
.jpg)