

Synopsis
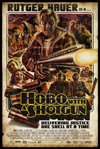
A train pulls into the station—it’s the end of the line. A Hobo jumps from a freight car, hoping for a fresh start in a new city. Instead, he finds himself trapped in an urban hell. This is a world where criminals rule the streets and Drake, the city’s crime boss, reigns supreme alongside his sadistic murderous sons, Slick and Ivan. Amidst the chaos, the Hobo comes across a pawn shop window displaying a second hand lawn mower. He dreams of making the city a beautiful place and starting a new life for himself. But as the brutality continues to rage around him, he notices a shotgun hanging above the lawn mower… Quickly, he realizes the only way to make a difference in this town is with that gun in his hand and two shells in its chamber.
Metrics
| Opening Weekend: | $12,046 (1.7% of total gross) |
| Legs: | 33.44 (domestic box office/biggest weekend) |
| Domestic Share: | 84.2% (domestic box office/worldwide) |
| Production Budget: | $3,000,000 (worldwide box office is 0.3 times production budget) |
| Theater counts: | 2 opening theaters/21 max. theaters, 5.8 weeks average run per theater |
| Infl. Adj. Dom. BO | $956,154 |
Latest Ranking on Cumulative Box Office Lists
| Record | Rank | Amount |
|---|---|---|
| All Time Domestic Box Office (Rank 9,401-9,500) | 9,476 | $703,372 |
| All Time International Box Office (Rank 16,701-16,800) | 16,723 | $131,581 |
| All Time Worldwide Box Office (Rank 16,001-16,100) | 16,078 | $834,953 |
| All Time Domestic Highest Grossing Limited Release Movies (Rank 2,001-2,100) | 2,078 | $703,372 |
See the Box Office tab (Domestic) and International tab (International and Worldwide) for more Cumulative Box Office Records.
Watch Now On
| Google Play: | Google Play |
| Hulu: | Hulu |
Movie Details
| Domestic Releases: | May 6th, 2011 (Limited) by Magnolia Pictures |
| Video Release: | July 5th, 2011 by Magnolia Home Entertainment |
| MPAA Rating: | Not Rated |
| Running Time: | 86 minutes |
| Comparisons: | vs. Doctor Strange in the Multiverse of Madness Create your own comparison chart… |
| Keywords: | Gangs, Revenge, Homeless, Sex Crimes, Corrupt Cops, Christmas in November, Vigilante, Organized Crime, Prostitution, Narcotics, Grindhouse, Based on a Fake Trailer |
| Source: | Original Screenplay |
| Genre: | Action |
| Production Method: | Live Action |
| Creative Type: | Contemporary Fiction |
| Production/Financing Companies: | Alliance Films, Rhombus Media, Whizbang Films, Yer Dead |
| Production Countries: | Canada, United States |
| Languages: | English |