January 11th, 2018
The BAFTA nominations were announced and this time The Shape of Water led the way with 12 nominations. The same films appear on many of the lists of nominees, but so far no one film has come to dominate the list. This makes it interesting, to say the least. There’s a good chance no one film will win the majority of prestige awards and that multiple films will have lots of reason to celebrate on February 18th when the awards are handed out.
More...
October 25th, 2017
There are not many films on this week’s list of home market releases, but there are several bigger titles making their home market debut. Some, like Cars 3, are only coming out on Video on Demand, but there are also some serious Pick of the Week contenders hitting DVD / Blu-ray as well. Of these contenders, War for the Planet of the Apes has the best combination of reviews and extras on the Blu-ray Combo Pack.
More...
August 23rd, 2017

It was a shallow week on the theater average chart with only three films with averages above $10,000 and none that topped that mark by a serious margin. Gook topped the chart with an average of $13,522 in two theaters. Ingrid Goes West is arguably more impressive, as it earned an average of $10,284 in 26 theaters during its second weekend of release. The only other film in the $10,000 club was Crown Heights with an average of $10,058 in three theaters.
More...
August 16th, 2017
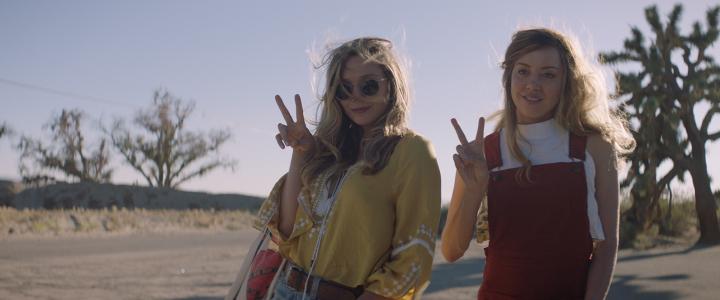
Ingrid Goes West opened in first place on the theater average chart with an average of $45,100 in three theaters. This is the third best average of the year behind The Big Sick (average of $84,315 in five) and The Beguiled ($57,323 in four). A24 had another success with Good Time earning an average of $31,275 in four theaters. The Trip to Spain opened with an average of $15,102 in three theaters, which is in the middle of the franchise average so far. Finally there’s Wind River, which was the only holdover in the $10,000 club. It managed an average of $13,615 in 45 theaters and already has nearly $1 million in limited release.
More...
August 9th, 2017
-1-News.jpg)
The Weinstein Co. is breathing a huge sign of relief as Wind River had the best theater average of the weekend with $40,390 in four theaters. This is the fourth best average of the year behind The Big Sick (average of $84,315 in five); The Beguiled ($57,323 in four); and Beauty and the Beast ($41,508 in just over 4,200). Wolf Warriors 2 saw its theater average grow to $15,843. The final film in the $10,000 club was Columbus, which earned an average of $13,410 in two theaters.
More...
August 2nd, 2017

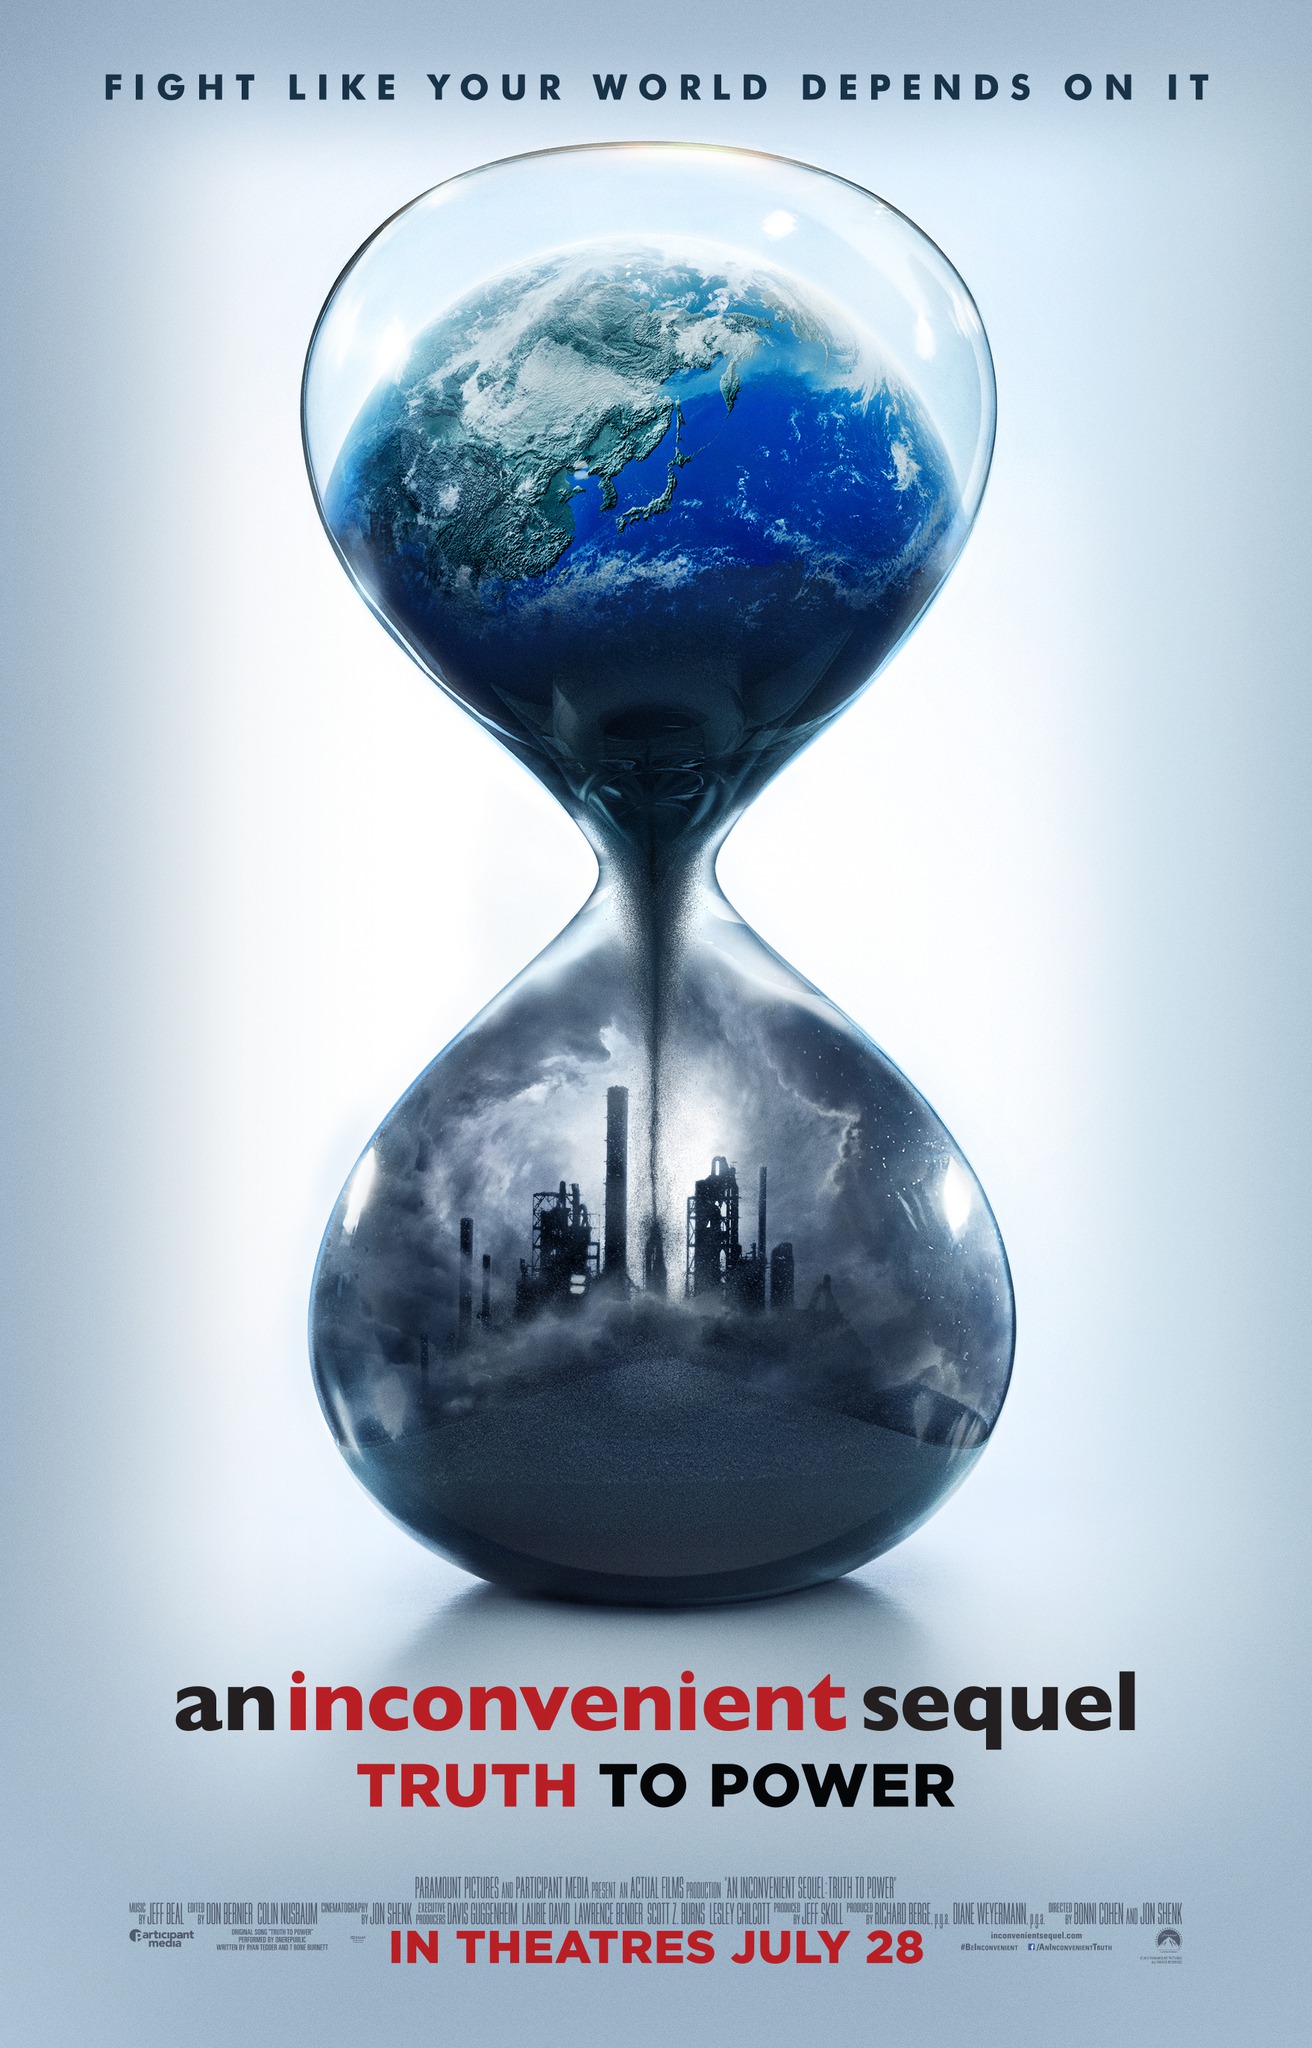
This weekend’s winner on the theater average chart is an unusual one. It is rare for documentaries to get a sequel and it is rare for documentaries to land in first place on the theater average chart. An Inconvenient Sequel opened with an average of $31,206 in four theaters, which is a good sign going forward. Menashe looks like it will be another success for A24, as it earned an average of $20,693 in three theaters. Detroit is planning to expand wide on Friday, so its average of $17,510 in 20 theaters is a good start. Brigsby Bear was the final film in the $10,000 club earning an average of $13,217 in three theaters.
More...
July 30th, 2017

A solid second weekend will be enough to keep Dunkirk at the top of the box office chart this weekend, as The Emoji Movie falls short of a par performance for a family-friendly animated film. Christopher Nolan’s war movie will fall 44% from it opening—a decent figure these days—to earn $28.1 million this time around, according to Warner Bros.’ projection released on Sunday morning. That will take it past $100 million domestically today, puts it on course for around $200 million domestically in total.
More...
July 28th, 2017
-1-News.jpg)
There are a lot of great movies on this week’s list, including Women Who Kill, Rumble: The Indians who Rocked the World, Menashe, Brigsby Bear, and Detroit. That last film is opening in limited release, but it deserves box office success, so hopefully this won’t hurt. An Inconvenient Sequel isn’t quite great, but it is good enough to be worth seeing.
More...
May 8th, 2017
Documentary with Al Gore opens July 28 ... Full Movie Details.
More...