March 6th, 2018
-1-News.jpg)
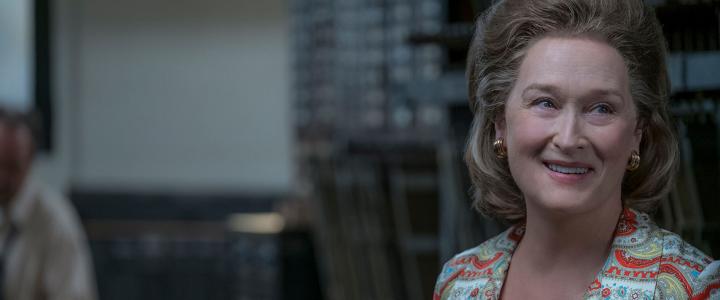
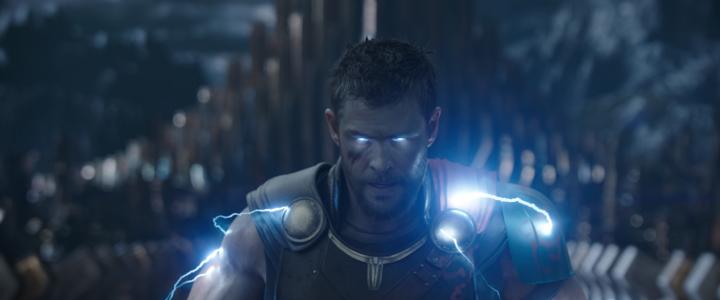
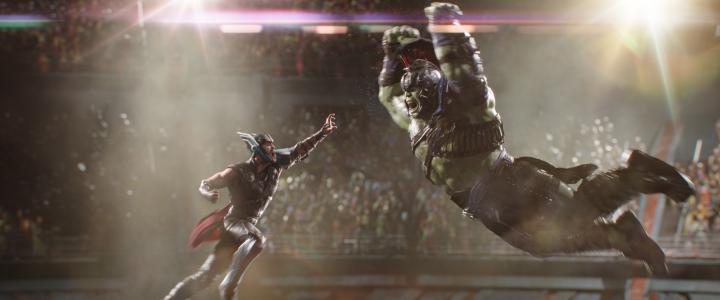
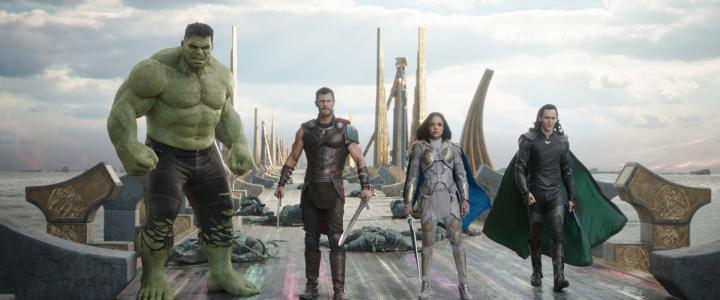
Thor: Ragnarok is by far the biggest Blu-ray release of the week and one of the best blockbusters of 2017. However, it was already named Pick of the Week last week, so we will have to pick a different film this week. There are a few contenders: The Breadwinner, Faces Places, and Lady Bird. All three of them are Oscars nominated films, none of them won. It was a close call, but in the end, Lady Bird won.
More...
March 4th, 2018
It’s Oscar night and we will be live blogging the show. We will announce the winners and have our reactions as they happen, while keeping track of how our readers did in predicting the outcomes.
More...
March 4th, 2018

It’s Oscar night and we will be live blogging the show. Before that, let’s take a last look at the nominations with a few annotations. Nominees in Italics are those that have received the most votes from our readers so far in our Oscar contest (which is open to new entries until noon, Pacific, today—enter now!). Bold films are those films I think will win. Meanwhile, those that are Underlined are those I want to win. Not all categories have underlined nominees, because not all categories have someone I’m cheering for, or because there are two nominees I couldn’t pick between. For example, I will be happy no matter who wins Best Supporting Actress. One last note: The contest is still going and the leading for Best Picture Switched from The Shape of Water to Three Billboards Outside Ebbing, Missouri to tied over the time I was writing this story. This is the closest I’ve ever seen it. Guessing the best picture correctly will go a long way to winning.
More...
March 3rd, 2018
-3-News.jpg)
The Independent Spirit Awards were handed out tonight, and Get Out was the big winner, sort of. It earned two Awards, including the two most prestigious, awards. However, it wasn’t the only film to pick up two awards tonight.
More...
March 1st, 2018
With our annual Oscar Prediction contest underway, now is the best time to look at the nominees and try and figure out who the favorites are and which films should just feel honored to be nominated. We end with the biggest award of the night: Best Picture. It is actually competitive this year with two films in a tight race, while there is a long shot with a shot.
More...
March 1st, 2018
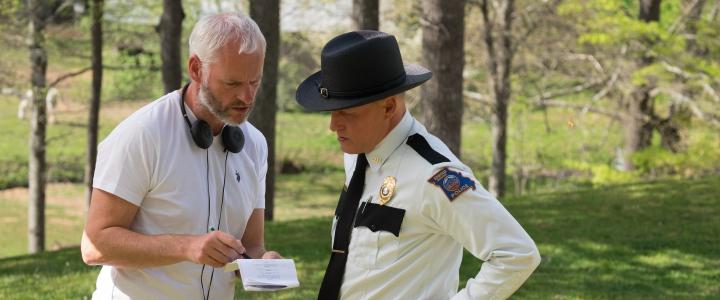
With our annual Oscar Prediction contest underway, now is the best time to look at the nominees and try and figure out who the favorites are and who should just feel honored to be nominated. Today we look at Best Director, which I think is a more competitive category than most people think it will be.
More...
February 27th, 2018
-2-News.jpg)
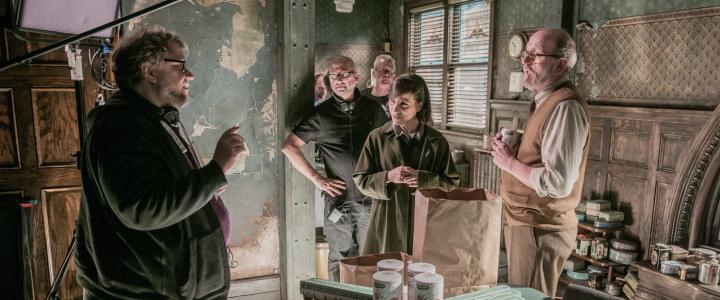
With our annual Oscar Prediction contest underway, now is the best time to look at the nominees and try to figure out who the favorites are and which films should just feel honored to be nominated. Today we look at the two Screenwriting Categories, ending with with Best Original Screenplay. This category is actually competitive, which is the first time I’ve been able to say that so far this year. In fact, there are three nominees that have a reasonable shot at winning.
More...
February 22nd, 2018
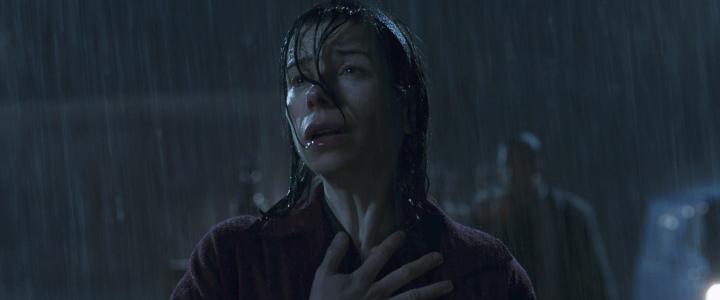
With our annual Oscar Prediction contest underway, now is the best time to look at the nominees and try to figure out who the favorites are and who should just feel honored to be nominated. This week we have been looking at the four acting categories, ending with Best Lead Actress. In this category, there is an overwhelming favorite. ... Most of the categories we will talk about next week are much more competitive.
More...
February 20th, 2018

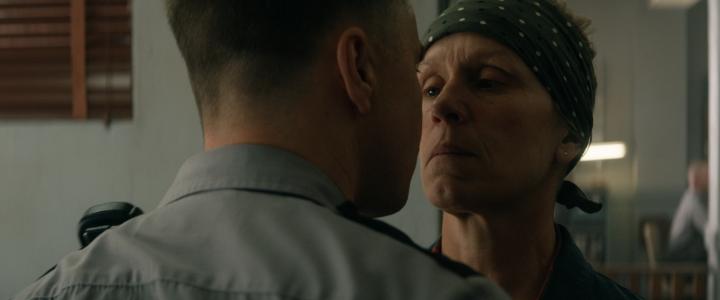
With our annual Oscar Prediction contest underway, now is the best time to look at the nominees and try and figure out who the favorites are and who should just feel honored to be nominated. This week we look at the four acting categories, starting with Best Supporting Actress. In this category, there is an overwhelming favorite. And here’s a spoiler for the rest of the week, every single acting category has an overwhelming favorite.
More...
February 13th, 2018

Golden Exits earned first place with $11,719 in its lone theater. The only other film in the $10,000 club was Fifty Shades Freed with an average of $10,234.
More...
February 13th, 2018
-1-News.jpg)
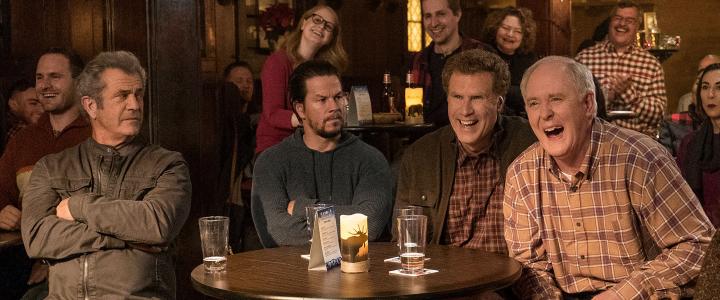
It’s not a good week in terms of box office numbers, as the biggest box office hit to come out this week is Wonder. It is also one of the best new releases of the week and a contender for Pick of the Week. Other contenders for Pick of the Week include Blade of the Immortal, Night of the Living Dead, The Silence of the Lambs, and The Sinner: Season One. In the end, it was a coin toss between Blade of the Immortal and Night of the Living Dead and the former won.
More...
January 31st, 2018
-2-News.jpg)
Padmaavat was the only film to hit the $10,000 club earning an average of $13,179 in 324 theaters.
More...
January 28th, 2018
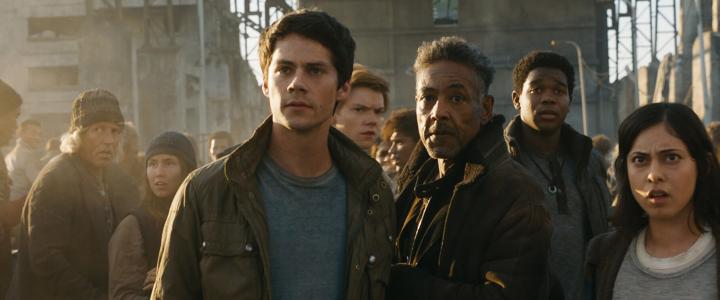
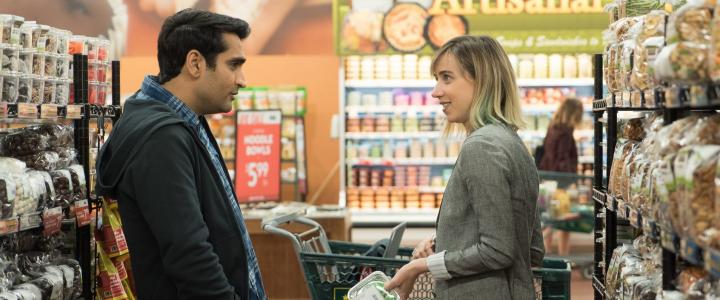
The delayed final film in the Maze Runner trilogy, The Death Cure, will open with $23.5 million, per Fox’s Sunday morning estimate. With another $82 million overseas so far, the film will have earned a little over $100 million by the end of the weekend, and its early international pace looks a little better than The Scorch Trials, which amassed $78 million over its first two weekends back in 2015. (Scorch Trials had a more staggered release, making a direct comparison difficult.)
More...
January 23rd, 2018

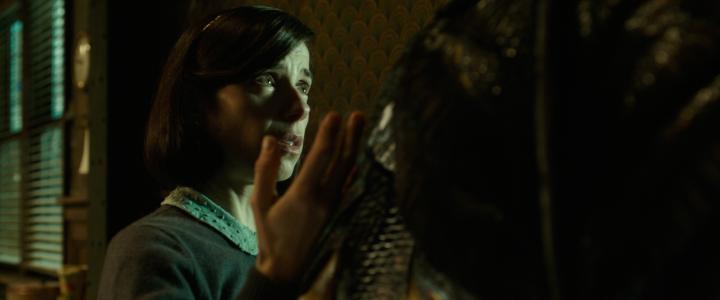
The Oscar nominations were announced starting at just after 5 am Pacific time. They do this every year and no one has been able to adequately explain why to me. At least there were some interesting results this year. The Shape of Water led the way with 13 nominations, which is one below the current record and nearly as many as the next two films combined. Overall, there were seventeen films that earned two or more nominations.
More...
January 17th, 2018
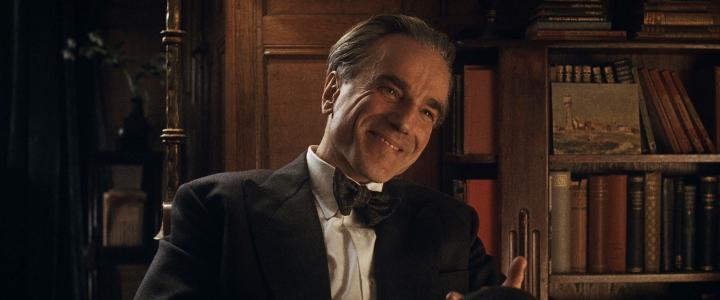
Phantom Thread was the only film in the $10,000 club this past weekend, earning an average of $18,513 in 62 theaters.
More...
January 11th, 2018
Directors Guild of America is one of those awards groups that spread out their nominations, but the last of them were announced today. There are some pleasant surprises and what is possibly the biggest shock of Awards Season so far. The only film to earn two nominations was Get Out.
More...
January 11th, 2018
The BAFTA nominations were announced and this time The Shape of Water led the way with 12 nominations. The same films appear on many of the lists of nominees, but so far no one film has come to dominate the list. This makes it interesting, to say the least. There’s a good chance no one film will win the majority of prestige awards and that multiple films will have lots of reason to celebrate on February 18th when the awards are handed out.
More...
January 7th, 2018

The Golden Globes winners were announced on Sunday and there were a few surprises worth talking about, starting at the top. I was not expecting Three Billboards Outside Ebbing, Missouri to be the big winner of the night, but it was with four wins. Only two other movies, The Shape of Water and Lady Bird, won more than one award during the night.
More...
January 5th, 2018
-2-News.jpg)
The Producers Guild of America finally finished announcing their nominations. (They spread out their announcements for reasons I’ve never quite understood.) It is a strange year for the PGAs, as there was a tie resulting in 11 films being nominated for the top prize.
More...
January 4th, 2018
The Writers Guild of America is the latest group to announce award nominees. There are a lot of categories that WGA hand out awards for, but only three of them are for theatrical releases. The list of nominees include several major Awards Season players, and not a lot of surprises. The Big Sick, Lady Bird, The Disaster Artist, Get Out, The Shape of Water… We've seen almost all of these films appear on lists of nominations before.
More...
January 3rd, 2018
The Post remained the top film on the theater average chart for the second weekend is a row, earning an average of $62,342 in nine theaters and has earned nearly $2 million at the box office. It wasn’t the only film in the $10,000 club; in fact, there were seven such films. Second place went to Phantom Thread, with an average of $54,124 in four theaters. Jumanji: Welcome to the Jungle was the best of the wide releases earning an average of $13,294. I, Tonya earned an average of $12,461 in 49 theaters during its fourth weekend of release. The overall number one film, The Last Jedi, was right behind with $12,410. Along With the Gods: The Two Worlds earned an average of $11,370 in 17 theaters, while the final film in the $10,000 club was Film Stars Don’t Die in Liverpool, which earned an average of $11,298 in four theaters.
More...
December 19th, 2017

The Last Jedi became the biggest wide release of the year on the theater average chart with $51,987, overtaking the previous leader, Beauty and the Beast, which had an opening weekend average of $41,508. Last week’s number one film, I, Tonya was pushed into second place with an average of $34,256 in five theaters. The film clearly has more room to grow. Call Me by Your Name was well behind with an average of $16,398 in 30 theaters. There were two more holdovers in the $10,000 club: The Shape of Water at $10,828 in 158 threatres and Darkest Hour at $10,090 in 84.
More...
December 13th, 2017
The Screen Actors Guild were the third group to announce their nominations for this awards season. So far there have been three different films earning the most nominations. Three Billboards Outside Ebbing, Missouri picked up four nominations, which is extra impressive, as there are only six theatrical categories.
More...
December 12th, 2017
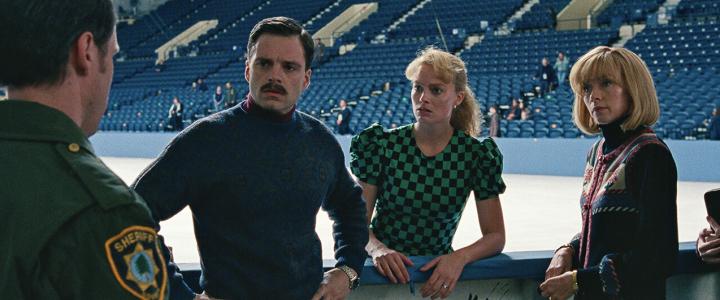
There was another Oscar contender on top of the theater average chart this weekend, as I, Tonya earned an average of $66,039 in four theaters. Call Me by Your Name was the next best film with an average of $31,761 in nine theaters. The film isn’t expanding as fast as one would expect, given its theater average, but this could be because the studio doesn’t think it has mainstream appeal. The Shape of Water was close behind with an average of $27,843 in 41 theaters and it has already earned some measure of mainstream success. The final film in the $10,000 club was Darkest Hour with an average of $13,989 in 53 theaters.
More...
December 11th, 2017
The Golden Globes nominations are the second major Awards Season set to come out. Sort of. (WGA announced the nominations for TV, radio, etc., but not their theatrical nods.) It is still very early in the year, so it is hard to say if there are any real snubs, or if there are any real favorites. The Shape of Water led the way with seven nominations, while The Post and Three Billboards Outside Ebbing, Missouri were right behind with six a piece.
More...
December 10th, 2017
-14-News.jpg)
Coco remains the number one movie at the box office this weekend by a considerable margin, mainly due to a lack of serious competition from new releases. Disney’s animated adventure will gross about $18.3 million this weekend, for a domestic total of $135.5 million. The film will also pile up another $55.3 million internationally, taking its worldwide cume to $389.5 million. It still has some big openings to come, including Brazil, Korea, the UK, and Japan in January, so it has some way to go, although its progress will be eclipsed by The Last Jedi for the next few weeks.
More...
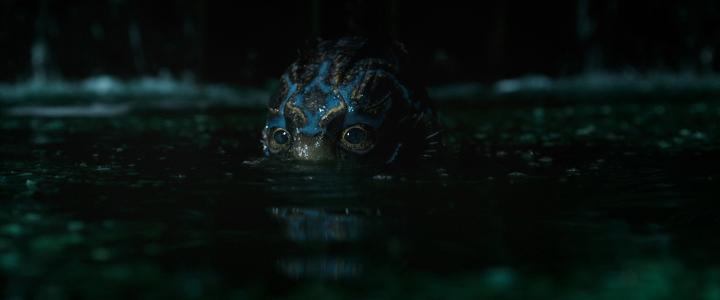
December 6th, 2017
It was another stellar weekend at the box office, at least as far as the theater average chart was concerned. The Shape of Water earned an average of $83,282 in two theaters. This is the fourth best of the year so far. Call Me by Your Name was right behind with an average of $73,890 in four theaters. This is by far the best result of the year for a holdover, more than doubling Lady Bird’s sophomore stint. However, Lady Bird expanded its theater count during its second weekend of release, while Call Me by Your Name did not. The Disaster Artist was close behind with an average of $63,755 in 19 theaters. You could argue this was the best result of the week, because the film was playing in many more theaters than the two films above it. Wonder Wheel was well back with an average of $28,111 in five theaters. Normally this would be an amazing start, but this week it won’t make an impact and it could fade away by the end of the year. Finally, Darkest Hour was the final film in the $10,000 club earning an average of $27,093 in four theaters during its second weekend of release.
More...
December 3rd, 2017
-9-News.jpg)
The weekend after Thanksgiving is usually when the studios take a breather before the big Christmas season, and this year is no different, with no new wide releases, and relatively minor shuffles on screen use at the theaters. It’s therefore little surprise that Coco holds on at the top of the chart, and its strong reviews and season-friendly nature help it to extend its lead over Justice League. Coco is headed towards $26.114 million this weekend, according to Disney, for $109 million or so to date. That’s down 49% from last weekend. Justice League, meanwhile, drops a more troubling 60% to $16.58 million, for $197 million after three weekends.
More exciting action lies among the limited and expanding releases, however…
More...
November 28th, 2017

Call Me by Your Name dominated the theater average chart with an average of $103,233 in four theaters. It is the first film of the year to reach the $100,000 mark on the per theater chart. Lady Bird was the previous yearly champion with an average of $91,109, also in four theaters. The second-best average of the week was earned by Darkest Hour at $43,752 in four theaters. Bombshell: The Hedy Lamarr Story earned $18,742 in one theater; that’s amazing for a documentary. The overall number one film, Coco, earned an average of $12,742. The only holdover in the $10,000 club was Justice League, as it pulled in $10,143.
More...
November 22nd, 2017

The Independent Spirit Awards nominations were announced yesterday and thus the 2017 Awards Season begins. The movie with the most nominations is Call Me by Your Name, which opens on Friday. This is amazingly good timing. It’s not the only film that should get a financial boost.
More...
November 21st, 2017
-8-News.jpg)
Justice League topped the theater average chart with $23,165 in just over 4,000 theaters. This is in the top ten best theater averages for any wide release that has come out this year, but it is about 25% lower than it needed to be. Last week’s winner, Three Billboards Outside Ebbing Missouri was pushed into second place with an average of $20,796 in 53 theaters. Its strong hold plus its early success during Awards Season should help it stick around in theaters for a long time. Roman J. Israel, Esq was next with an average of $15,500 in four theaters. This would be a good start for a limited release, but it is scheduled to expand wide on Wednesday, so I’m not sure it is good enough. Finally, Lady Bird rounded out the $10,000 club with an average of $10,573 in 238 theaters. It has already earned a significant measure of mainstream success and it still has room to grow.
More...
November 21st, 2017
-7-News.jpg)
Justice League easily won the race for first place on the weekend box office chart. However, it only managed $93.84 million, which is substantially lower than it was expected to open with. In fact, it’s the first film in the DCEU to not open with more than $100 million. (To be fair, it is doing better internationally.) Wonder was a surprising hit in second place and it helped the box office rise 32% from last weekend to $199 million. More importantly, this weekend was 26% higher than the same weekend last year. 2017 ended its most recent slump, but it is still 4.5% or $430 million behind last year’s pace at $9.21 billion to $9.65 billion.
More...
November 19th, 2017
-6-News.jpg)
Justice League was meant to the be the big pay-off for the first phase of the DC Extended Universe, bringing together the characters introduced in Man of Steel, Batman v Superman: Dawn of Justice, and Wonder Woman, and setting the stage for next year’s Aquaman. The huge success of Wonder Woman this Summer seemed to be just the kick the franchise needed, and, given the history of the Marvel Cinematic Universe, which enjoyed steadily building success leading up to the gigantic opening of The Avengers, an opening north of $150 million, and maybe even approaching $200 million seemed a possibility a couple of months ago. In that context, the $96 million projected weekend announced by Warner Bros. this morning looks like a huge disappointment. What does it mean for the franchise?
More...
November 18th, 2017
-5-News.jpg)
As predicted, Justice League dominated the Friday box office chart, earning four times its nearest competitor. However, it only managed $38.8 million on Friday, which is well below expectations. In fact, tracking has been dropping and the film is now widely expected to open with less than $100 million over the weekend, making it the only film in the DCEU to fail to reach the century mark during its opening weekend. There are a number of reasons why this film is struggling. Firstly, except for Wonder Woman, no film in the franchise has earned good reviews and mainstream audiences may have given up on the franchise. Secondly, the troubled production meant a lot of people who were part of the target audience, but not hardcore D.C. Comics fans, are taking a wait-and-see approach here. Since its reviews are bad, these people are staying home. Its CinemaScore is just a B plus, so it won’t have great legs going forward. Finally, there’s Thor: Ragnarok. That film is proving to be stronger than expected competition, as it started faster and is holding up better than most similar films. I think Warner Bros. is going to have to rethink the entire DCEU before going forward. Aquaman is already in post-production and Wonder Woman 2 is definitely going forward. After that, I’m not sure what films will or will not be made.
More...
November 14th, 2017
This week’s winner on the theater average chart was Three Billboards Outside Ebbing Missouri, opening with an average of $80,542 in four theaters. This puts it in third place for the year, behind Lady Bird ($91,109) and The Big Sick ($84,315). Speaking of Lady Bird, the film earned an average $32,426 in 37 theaters, putting it in the top ten over the weekend. Bill Nye Science Guy is traveling the country and this week it was playing in one theater in Los Angeles earning $14,350. Thor: Ragnarok was right behind with an average of $13,990. The final film in the $10,000 club was Thelma, which earned $10,841 in one theater.
More...
November 14th, 2017
Thor: Ragnarok led the weekend chart and actually beat our prediction by a small degree with $57.08 million. The two new releases, Daddy’s Home 2 and Murder on the Orient Express, also beat expectations. Unfortunately, that wasn’t enough to help the overall box office, as it fell 16% from last weekend to $151 million over the weekend. This is 4.9% lower than the same weekend last year. 2017 has fallen further behind 2016 at $8.98 billion to $9.46 billion. 2017 is 5.1% or $480 million behind last year’s pace and I’ll be happy if we can cut that deficit in half by the end of the year.
More...
November 12th, 2017
Thor: Ragnarok maintains a firm hold on top spot at the domestic and international box office this weekend, with a respectable decline of 54% at home taking it to $56.6 million for the weekend and $211.6 million to date. With another $75.9 million internationally, for a total of $438.5 million overseas,
Ragnarok will pass $650 million worldwide today. That makes it the most successful Thor film already, and it seems like it should retain decent traction into the holidays, even with Justice League coming out next weekend.
More...
November 11th, 2017
As predicted, Thor: Ragnarok easily won on Friday with $18.28 million. This is 61% lower than its opening Friday, which is better than most blockbusters manage. It also puts it on pace for $56 million during its sophomore stint, which is exactly on track with my prediction. Meanwhile, Disney’s share of the film’s worldwide box office is already above the film’s $180 million production budget, so profitability is all but guaranteed.
More...
November 8th, 2017
A yearly record was broken this past weekend, as Lady Bird had the best theater average of the year so far with an average of $91,109 in four theaters. This tops the previous yearly record of $84,315 by The Big Sick. It wasn’t the only monster hit on the theater average chart this week. Thor: Ragnarok earned an average of $30,085 in just over 4,000 theaters. There were also two other films that just managed to earn a spot in the $10,000 club, 1945 and Last Flag Flying, which earned averages of $10,317 in two theaters and $10,140 in four theaters respectively.
More...
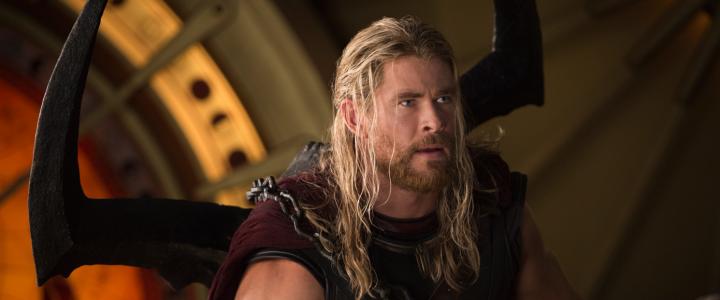
November 5th, 2017
Thor: Ragnarok continues a remarkable record for the Marvel Cinematic Universe this weekend by posting a $121 million opening weekend, according to Disney’s Sunday morning estimate. That’s a significant increase from the $85.7 million of Thor: Dark World, and means that each sub-franchise based on an individual character has had increasing open box office from film to film: Iron Man’s openings went from $102 million, to $128 million, to $174 million; Captain America went $65 million, $95 million, $179 million; and now Thor has gone $65 million, $86 million, and $121 million.
More...
November 4th, 2017
It looks like Thor: Ragnarok will top predictions and our increased predictions based on its Thursday previews. The film earned $46.82 million on Friday, which is the fifth-biggest opening day in 2017. Additionally, while its reviews are off their peak, its Tomatometer Score is still 93% positive, and it earned an A from CinemaScore. Both of these results suggest long legs, meaning it should hit $115 million during its opening weekend, more or less. If it can reach that over the weekend, then it will only need average legs to get to $300 million domestically. Granted, Justice League does open in just two weeks and that will hurt this film’s legs, but this is still a start worth celebrating.
More...
November 3rd, 2017

A few films on this week’s list were earning some pre-release buzz. Sadly, LBJ and Last Flag Flying missed expectations with critics, so they could struggle at the box office. On the other hand, Lady Bird is earning 100% positive reviews, while Princess Cyd’s reviews are not that far behind, so perhaps they will succeed where the others fail.
More...
October 30th, 2017
Drama starring Saoirse Ronan, written and directed by Greta Gerwig, opens November 3 ... Full Movie Details.
More...
.jpg)