October 24th, 2018

It is a slow week on the home market, as Mamma Mia: Here We Go Again! is the only first run release. There are several horror films that are selling well enough to be worth talking about, but that is all. As far as the best of the best are concerned, the two I’m most interested in and I put in requests for screeners for both are BlacKkKlansman and Incredibles 2, but they are only coming out on VOD this week. I don’t like handing out Pick of the Week titles to VOD releases, so the real race is between The Americans: The Complete Final Season and Made In Abyss: Season One. Both are worth picking up, but I think there will be a full series Megaset for The Americans, so I’m giving the title to Made In Abyss.
More...
August 16th, 2018
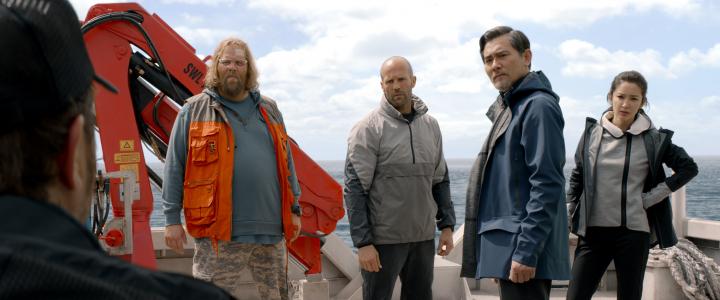
The Meg led the way on the international chart cracking the century mark with $101.5 million on 30,212 screens in 42 markets and a worldwide opening of $146.9 million. This is great news, and the film cost Warner Bros. $130 million to make, after tax rebates and the like, so the film needed a monster opening to break even any time soon. The film’s biggest market was China, where it earned $49.83 million on 16,307 screens. It only managed third in that market, but it was a very busy weekend with two massive local hits also debuting this weekend. The film was able to top the charts in Mexico with $6.30 million on 1,936 screens and in Russia with $5.48 million on 2,628. It wasn’t as potent in the U.K., but it still topped the chart with $4.66 million in 499 theaters. The film has yet to open in South Korea, Australia, France, and Japan, so it should stick around the top five for a bit.
More...
August 14th, 2018

The Meg was arguably the biggest box office surprise of the summer, earning more during its opening weekend than many thought it would earn in total and it doubled our prediction. It also earned more than the next three films earned combined, so it was a rather one-sided affair at the box office. Its $45.40 million debut did help the overall box office rise 5.6% from last weekend reaching $147 million. More importantly, this is 26% higher than the same weekend last year. Year-to-date, 2018 now has a 9.1% / $640 million lead over 2017 at $7.68 billion to $7.04 million.
More...
August 8th, 2018
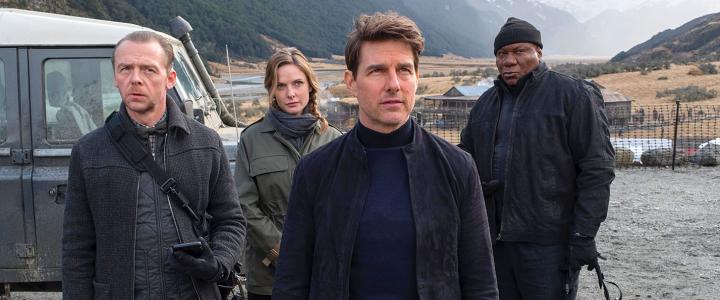
Mission: Impossible—Fallout returned to first place on the international chart with $76 million in 56 markets for totals of $205 million internationally and $330 million worldwide. The film opened in first place in both Japan and France, earning $8 million in each market. By this time next week, the film will no longer be in last place for the franchise, but it is still too soon to tell if it will become the biggest hit out of the six films.
More...
August 7th, 2018

Mission: Impossible—Fallout remained on top of the weekend box office chart thanks in part to a stronger than expected hold and in part to weaker than expected competition. Christopher Robin was the only new release to make any real noise opening in second place with $24.59 million, while The Spy Who Dumped Me opened with less than half of that. Overall, the box office earned $139 million, 11% lower than last weekend. More importantly, this was 14% higher than this weekend last year. 2018 extended its lead over 2017 to just under $600 million or 8.7% at $7.46 billion to $6.86 billion.
More...
August 2nd, 2018
-2-News.jpg)
There are four films opening wide or semi-wide during the first weekend of the August. This includes the only potential $100 million hit, Christopher Robin. The Spy Who Dumped Me’s roller coaster ride on Rotten Tomatoes appears to be coming to an end at the mediocre end of things, but that’s not bad compared to the average August release. On the other hand, bad is the best way to describe The Darkest Minds, while calling Death of a Nation “bad” is a glorious understatement. While most of the new releases are not expected to make an impact at the box office, there could be a close race on top between Christopher Robin and Mission: Impossible—Fallout. This weekend last year, The Dark Tower opened in first place with just under $20 million. This year, the top two films should beat that with ease. Last year’s depth was better, but 2018 should still win in the year-over-year comparison.
More...
August 1st, 2018
-1-News.jpg)
Hello Mr. Billionaire, a Chinese remake of Brewster’s Millions, opened in first place in China and the international market with $132.26 million. That’s more than 800 million in the local currency, while it took just one more day to live up to its name and reach 1 billion Yen in revenue.
More...
July 30th, 2018
Mission: Impossible—Fallout was easily the biggest hit of the weekend earning more than the rest of the top five combined. Its opening weekend of $61.24 million was the best in the franchise, but it wasn’t enough to prevent the overall box office from dropping 9.3% from last weekend earning $156 million. This is 8.0% higher than the same weekend last year, which is the more important result. 2018 is now ahead of 2017 by a margin of 8.5% or $570 million at $7.23 billion to $6.66 billion.
More...
July 29th, 2018
Mission: Impossible—Fallout dominated the weekend box office chart with $61.5 million over the weekend. This is the best opening in the franchise, unless you take inflation into account. Assuming the film can have the same legs as Rogue Nation, it will be able to top $200 million domestically. The film’s reviews and its A from CinemaScore, and the nearly total lack of quality competition in August, make that seem likely; however, I think we should wait a week before predicting a final box office tally. Internationally, the film made $92 million in 36 markets, which is close to 20% higher than Rogue Nation’s debuts in those markets, which should be enough to keep Paramount happy. Although given the studio’s struggles in the past few years, if the film was just marginally profitable, it would have been reason for Paramount to celebrate.
More...
July 28th, 2018

Mission: Impossible—Fallout earned $23.0 million on Friday, putting it on pace for an opening weekend of $58 million, according to Paramount. This is the fastest start in the franchise; although given the age of the franchise and the ticket price inflation, that’s much less impressive. The film’s reviews are among the best we’ve seen from a wide release this year, while it earned an A from CinemaScore, so its legs should be long. That said, this is weaker than we predicted. I really thought the reviews would translate into more ticket sales.
More...
July 26th, 2018
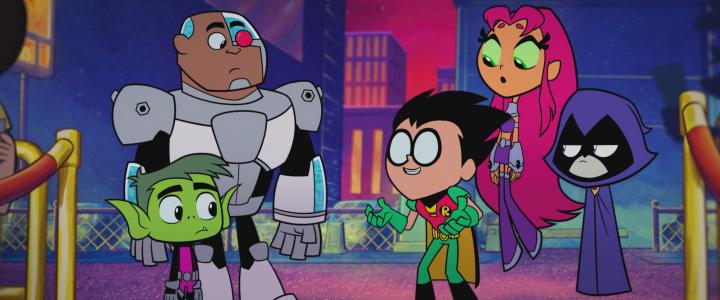
The last weekend of the month has two wide releases, both of which are earning stellar reviews. Mission: Impossible—Fallout is the sixth film in the franchise. It wasn’t that long ago where a sixth installment in a franchise would be impressive. Teen Titans Go! To the Movie is the first big screen appearance for most of these characters. There should also be three, maybe four other films with $10 million or more during the weekend. 2018 won’t need that depth to win in the year-over-year comparison, as this weekend last year was pretty weak, so the month should end on a winning note.
More...
July 25th, 2018
-1-News.jpg)
Eighth Grade remained on top of the theater average chart with an average of $24,975 in 33 theaters over the weekend. McQueen and Blindspotting were right behind with averages of $24,718 and $24,024 in 4 and 14 theaters respectively. The re-release of Wanda opened with $10,679 in one theater. The two wide releases of the week were next with The Equalizer 2 and Mamma Mia: Here We Go Again! in a virtual tie at $10,629 and $10,537 respectively.
More...
July 24th, 2018
Skyscraper roared to first place on the international chart, thanks mostly to its debut in China. Overall, it earned $77.8 million in 68 markets for totals of $135.7 million internationally and $182.8 million worldwide. It opened in first place in China with $48.11 million over the weekend for a total opening of $48.51 million. The second biggest new market was Colombia, where it earned $1.38 million on 195 screens. Its best holdover was in Mexico where it was down 50% to $1.68 million on 815 screens for a two-week total of $7.46 million.
More...
July 23rd, 2018

The Equalizer 2 was the surprise winner at the weekend box office chart with $36.01 million over the weekend, which put it just ahead of the $34.95 million earned by Mamma Mia: Here We Go Again! The overall box office topped expectations with $171 million, up 2.7% from last week. This is 5.1% lower than the same weekend last year, but this is better than expected. Also, 2018 is still ahead of 2017 by a sizable margin of $560 million / 8.8% at $6.98 billion to $6.42 billion. Again, if 2018 just maintains the raw dollar margin for the rest of the year, it will be a reason to celebrate.
More...
July 22nd, 2018

In a shocking turn of events, The Equalizer 2 overtook Mamma Mia: Here We Go Again! over the weekend with $35.83 million. This is better than predicted and is better than the original managed. Its reviews are not great, but it earned an A from CinemaScore and it is aimed at a more mature target audience, so it should have better than average legs. We will have a better picture this time next week. Internationally, the film managed $3.3 million on 704 screens in 11 markets, including $2.2 million in Australia. The film first didn’t do great internationally, so while this is a 30% improvement, it is still nothing special.
More...
July 21st, 2018

Mamma Mia: Here We Go Again! had a stellar opening earning $14.28 million on Friday, which is enough to put it on pace for nearly $40 million opening. That’s on the very high end of expectations and more than enough to be considered a hit. With strong reviews and an A minus from CinemaScore, the film should have good legs. It won’t have as good legs as the original did, but $100 million is an easy goal after this opening.
More...
July 20th, 2018

Mamma Mia: Here We Go Again! pulled in $3.4 million during its previews on Thursday, which is a figure that is nearly impossible to judge. There simply are not enough live-action musicals released to compare to. The vast majority if those that do come out come out at Christmas time, so it is a poor comparison. Rock of Ages is the closest both in terms of style (Both films are Jukebox Musicals.) and release dates, but that film came out before midnight shows became standard. I’ve seen some compare it to Pitch Perfect 2, but that was a sequel and that messes with the comparisons. That said, $3.4 million is still a good amount. The reviews suggest good legs and a $35 million opening is likely, which is a little better than predicted, by a little bit.
More...
July 19th, 2018

At the beginning of the month, I didn’t have relatively high hopes for this weekend; I thought it could put up a fight in the year-over-year comparison, but would ultimately lose. That has changed and not for the better. Mamma Mia: Here We Go Again! is still widely expected to earn first place over the weekend, but it might not do well enough to finish with $100 million domestically. The Equalizer 2 won’t match its predecessor, not with the amount of action films struggling in theaters. Finally, Unfriended: Dark Web is opening in barely more than 1,500 theaters and it is going nowhere. Hotel Transylvania 3: Summer Vacation should have a good hold, but I’m not sure about any of the rest. This weekend last year, Dunkirk opened with just over $50 million and five other films earned $10 million or more over the weekend. There’s no way 2018 will match that. I don’t even think it will be close.
More...
July 1st, 2018

June was amazing, with two absolute monster hits and a solid $100 million hit. By the end of the month, 2018’s lead over 2017 will be well over $500 million, or close to 10%. Even if 2018 only managed to maintain this lead in terms of raw numbers for the rest of the year, it will be a massive jump at the box office. As for July, there are a couple of potential monster hits, Ant-Man and the Wasp and Mission: Impossible—Fallout, plus four potential $100 million hits. Last July, there was only one monster hit, Spider-Man: Homecoming, and three $100 million hits. I don’t think 2018 will match 2017 at the top, but 2018 appears to have more depth and that should put it a little ahead over the full month.
More...
December 21st, 2017
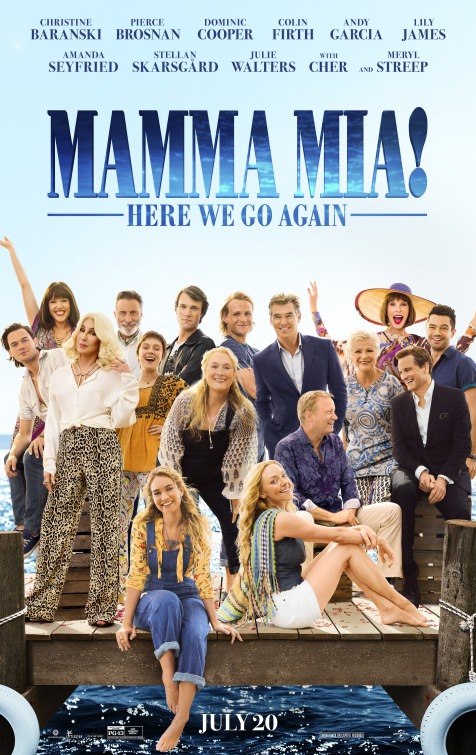
Musical starring Amanda Seyfried, Meryl Streep, Lily James, Christine Baranski, Jessica Keenan Wynn, Julie Walters, Alexa Davies, Pierce Brosnan, Jeremy Irvine, Colin Firth, Hugh Skinner, and Stellan Skarsgård opens July 20, 2018 ... Full Movie Details.
More...