March 29th, 2017
It’s a good week for Pick of the Week contenders, as there are seven such releases on this week’s list. Unfortunately, none of them really scream out as The Pick of the Week. Rogue One: A Star Wars Story is by far the biggest, but it is only out on Video on Demand right now, while Hidden Figures is the best, but again, it is only on VOD this week. There are also a couple of busted Oscar-bait films, Archer: Season Seven is only getting a DVD release, while the previous seasons came out on Blu-ray. In the end, I went with Mystery Science Theater 3000: Volume XXXVIII, partially to celebrate the return of the show.
More...
March 15th, 2017

There are a few Oscar-nominated films on this week’s list. However, it was still hard to come up with a Pick of the Week release. Most of them were like Elle with great reviews and weak extras. The DVD for Drunk History: Season Four has more than two hours of extras, but I admit it is an acquired taste. Fortunately, we do have a clear winner: The Love Witch on Blu-ray.
More...
January 24th, 2017
-2-News.jpg)
Split dominated the weekend box office earning $40.01 million, which is nearly double predictions and nearly double its nearest competition, xXx: Return of Xander Cage. The overall box office still shrunk from last weekend, but it was down just 3.2%, which is excellent for a post-holiday weekend. Compared to this weekend last year, 2017 was 27% stronger. Year-to-date, 2017 is still behind 2016, but that gap has closed to 9.4% at $736 million to $812 million.
More...
January 19th, 2017

The winners of our Ultimate Prize contest contest were determined and the entrants with the closest predictions for Patriots Day’s opening weekend were...
More...
January 18th, 2017

As expected, Hidden Figures remained in first place as the box office was dominated by holdovers. The best of the new releases / wide expansions was The Bye Bye Man, which earned fifth place with $15.20 million. On the positive side, while there was only one film to earn more than $20 million over the weekend, there were seven that earned $10 million or more. That’s really good depth. It’s good enough for an 8.5% increase from last weekend reaching $149 million. However, this is still 10% lower than the same weekend last year. Year-to-date, 2017 is behind 2016 by 15% at $562 million to $659 million, but again, it is way too soon to make any predictions.
More...
January 15th, 2017

A pile-up at the box office this weekend will leave a crush of new releases behind Hidden Figures and La La Land, which remain the top two films at the box office. Hidden Figures will be down just 10% (in part thanks to expanded distribution) to $20.45 million, for $54.8 million in total, as of Sunday evening. Fox is projecting a $25.3 million 4-day weekend for the film. La La Land is even more impressive, growing its box office by 43% and moving from fifth to second on the chart with $14.5 million, and $74.1 million to date. It’s record-breaking performance at the Golden Globes has clearly lifted it to another level with audiences.
More...
January 14th, 2017
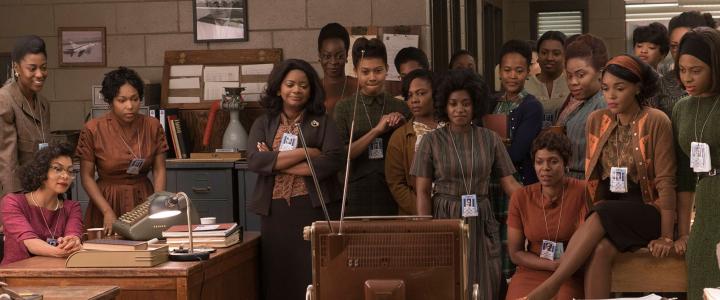
Hidden Figures unexpectedly led the way on Friday with $5.53 million. This is 28% lower than last Friday, but that was the film’s first weekend wide and this is a holiday weekend, so it should bounce back a lot over the rest of the weekend. Award-worthy reviews and continued Awards Season presence will also help the film earn about $23 million over the four-day weekend. Its running tally will be about $57 million on Monday, putting it on pace for $100 million domestically.
More...
January 13th, 2017
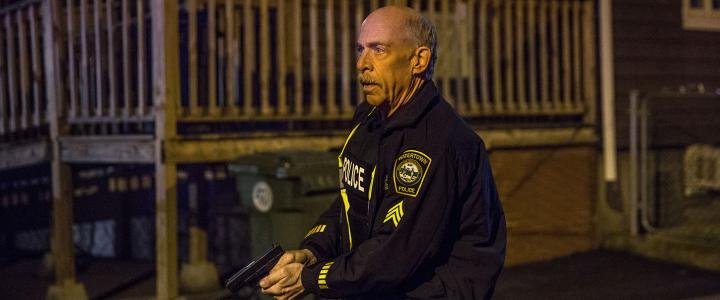
Patriots Day earned $560,000 from 2,000 theaters during its Thursday previews. This is less than half of what Hidden Figures made last week. Worse still, Patriots Day’s target audience should be more likely to go see a film’s previews than Hidden Figures’ target audience would be. That said, it is still a holiday weekend and it should bounce back over the next few days. I think it will miss our predictions, but it should come close with about $19 million.
More...
January 12th, 2017

Six films are opening or expanding this weekend, which have a shot at the top ten. However, only one of them, Patriots Day, has a real shot at first place. In fact, it might be the only “new” film in the top five. The biggest wide release of the week is Monster Trucks, which is opening in 2,800 theaters. I didn’t see that coming. [Ed.: The final announced theater count for Monster Trucks is an even more impressive 3,119] Meanwhile, Sleepless is only opening in 1,800 theaters, while Silence is expanding into 750 theaters. We still haven’t mentioned all of the new films. As for holdovers, Hidden Figures has a real shot at first place, while La La Land should get a boost from its Awards Season success. This weekend last year, Ride Along 2 opened with just over $35 million over the three-day weekend. There’s no film that will match that figure during the four-day weekend. On the positive side, there were only four films that earned more than $10 million during the three-day weekend and this year we should have five. That’s not enough to win in the year-over-year competition. It likely won’t even be close.
More...
January 12th, 2017

The winners of our Blood Oath contest contest were determined and the entrants with the closest predictions for Underworld: Blood Wars’s opening weekend were...
More...
January 10th, 2017

The theater average chart was dominated by holdovers, as is the norm this time of year. The top film was Patriots Day with an average of $14,972 in seven theaters. This bodes very well for its wide expansion next weekend. 20th Century Women is becoming a sleeper hit earning an average of $13,047 in ten theaters. This is one of those films that should be earning more Awards Season buzz, but I fear it has slipped between the cracks. Toni Erdmann and Paterson were neck-and-neck with averages of $10,472 and $10,205 respectively.
More...
January 5th, 2017
Next weekend, six films are opening or expanding wide, sort of. Six films opening or expanding wide is far too many for one weekend and it looks like two of the three expansions will only be semi-wide, while two of the three wide releases will open barely wide. This leaves Patriots Day and Sleepless as the only two real contenders for the target film in this week’s box office prediction contest. I’m going with Patriots Day even though it is technically expanding wide, because it has the clear advantage at the box office. In order to win, one must simply predict the opening weekend box office number for Patriots Day.
Whoever comes the closest to predicting the film’s opening 3-day weekend box office (Friday to Sunday), without going over, will win a copy of The Ultimate Legacy on DVD.
Whoever comes the closest to predicting the film’s opening 3-day weekend box office (Friday to Sunday), without going under, will win a previously reviewed movie.
Finally, we will be choosing an entrant from the group of people who haven’t won, or haven’t won recently, and they will also win a previously-reviewed movie.
Entries must be received by 10 a.m., Pacific Time on Friday to be eligible, so don't delay!
More...
January 4th, 2017
Hidden Figures rose to first place during its first full weekend of release with an average of $34,329 in 25 theaters. It already has more than $2 million and it expands wide on Friday. 20th Century Women was next with an average of $27,800 in four theaters. It isn’t a major player during Awards Season, but it is picking up enough nominations to help it stick around in theaters. Patriots Day was down just 8% earning an average of $21,117 in seven theaters. Last week’s winner, Silence, fell to an average of $20,827 in four theaters. If it has a similar drop next week, it will put its wide release in jeopardy. The best limited release of the week was Paterson, which earned an average of $17,334 in four theaters. Toni Erdmann earned an average of $14,000 in three theaters during its first full week of release. La La Land continues to expand, but remained in the $10,000 club with an average of $12,738. The overall number one film, Rogue One: A Star Wars Story, was next with an average of $11,934, while the second place film, Sing, was right behind with an average of $10,647.
More...
January 1st, 2017

December box office numbers helped 2016 end on ... a note. The good news and the bad news almost exactly balance out. On the one hand, Rogue One: A Star Wars Story will finish the year with more than $400 million after just 16 days of release. That’s a stunning amount of money that helped 2016 earn a record box office at the domestic market. However, Star Wars: The Force Awakens earned $650 million during December of 2015, so the month lost a lot of its lead over 2015, so much so that ticket sales fell behind last year’s total. The weakness at the end of the year will spill over into 2017, which is terrible news. A slow start could result in the dominant box office story being 2017 struggles compared to 2016. Bad news like this can sometimes become a self-fulfilling prophecy. Sadly, 2017 is also going to get off to a slow start when it comes to wide releases / expansions. There are 16 films scheduled to open or expand wide this month and none of them are expected to get to $100 million. It is likely none of them will even get very close. xXx: Return of Xander Cage is expected to be the best of a weak bunch, but I could see it getting beat by one of the five Oscar contenders opening wide this month, if it gets off to a slow start and one of the Oscar contenders starts picking up steam. Hidden Figures got off to a great start on Christmas Day and should it continue to earn Awards Season recognition, including some Oscar nominations, it could be in wide release well into February. Last January wasn’t as busy with 13 films opening or expanding wide over five weeks. Of these, two of them, The Revenant and Kung Fu Panda 3, topped $100 million domestically, while another, Ride Along 2, came close. 2017 is going to get destroyed in the year-over-year comparison.
More...
December 28th, 2016
-2-News.jpg)
Silence scored first place on the theater average chart earning an average of $32,720 in four theaters. Patriots Day was next with an average of $23,044 in seven theaters. Most impressively, Hidden Figures earned an average of $20,620 in 25 theaters, in just one day. The final film in the $10,000 club was the overall number one film, Rogue One: A Star Wars Story with an average of $15,404.
More...
December 23rd, 2016

Rogue One: A Star Wars Story grew by 12% to $16.77 million on Thursday for a first-week total of $222.00 million. This shows that it was hit by new releases on Wednesday, at least a little bit. It is impossible to compare this day to The Force Awakens, because this day in its run was Christmas Eve. For the record though, The Force Awakens fell by 28% to $27.40 million on that day and had pulled in $390.86 million during the same time period.
More...
December 23rd, 2016
-1-News.jpg)
There are a number of limited releases coming out this week spread from Wednesday through Sunday. This includes several that are aiming for Awards Season glory: 20th Century Women, Hidden Figures, Silence, and others. There might be too many great films on this week's list, which means some will not live up to their box office potential.
More...
December 22nd, 2016

As expected, Rogue One: A Star Wars Story led the way on Wednesday. It fell 15% to $14.97 million on Wednesday for a 6-day total of $204.23 million. By comparison, The Force Awakens rose 2% to $38.02 million on Wednesday for a six-day total of $363.46 million; however, it didn’t have to deal with three wide releases. In fact, it’s only “new” competition was the semi-wide expansion of The Big Short. Comparing the two movies’ daily numbers will get less illuminating until we get past Boxing Day, because the misalignment in the holidays will be playing a major role in the day-to-day changes.
More...