


Synopsis
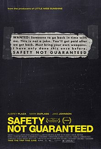
When an unusual classified ad inspires three cynical Seattle magazine employees to look for the story behind it, they discover a mysterious eccentric named Kenneth, a likable but paranoid supermarket clerk, who believes he’s solved the riddle of time travel and intends to depart again soon. Together, they embark on a journey that reveals how far believing can take you.
Metrics
| Opening Weekend: | $97,762 (2.4% of total gross) |
| Legs: | 8.48 (domestic box office/biggest weekend) |
| Domestic Share: | 90.7% (domestic box office/worldwide) |
| Production Budget: | $750,000 (worldwide box office is 5.9 times production budget) |
| Theater counts: | 9 opening theaters/182 max. theaters, 8.1 weeks average run per theater |
| Infl. Adj. Dom. BO | $5,431,923 |
Latest Ranking on Cumulative Box Office Lists
| Record | Rank | Amount |
|---|---|---|
| All Time Domestic Box Office (Rank 6,901-7,000) | 6,926 | $4,010,957 |
| All Time International Box Office (Rank 13,301-13,400) | 13,388 | $411,361 |
| All Time Worldwide Box Office (Rank 10,301-10,400) | 10,340 | $4,422,318 |
| All Time Domestic Highest Grossing Limited Release Movies (Rank 601-700) | 649 | $4,010,957 |
| All Time Domestic Box Office for Comedy Movies (Rank 1,401-1,500) | 1,410 | $4,010,957 |
| All Time International Box Office for Comedy Movies (Rank 2,501-2,600) | 2,588 | $411,361 |
| All Time Worldwide Box Office for Comedy Movies (Rank 2,001-2,100) | 2,078 | $4,422,318 |
| All Time Domestic Box Office for R Movies (Rank 2,401-2,500) | 2,439 | $4,010,957 |
| All Time International Box Office for R Movies (Rank 2,701-2,800) | 2,707 | $411,361 |
| All Time Worldwide Box Office for R Movies (Rank 2,801-2,900) | 2,873 | $4,422,318 |
See the Box Office tab (Domestic) and International tab (International and Worldwide) for more Cumulative Box Office Records.
Watch Now On
| Amazon VOD: | Amazon |
| iTunes: | iTunes |
Movie Details
| Domestic Releases: | June 8th, 2012 (Limited) by FilmDistrict |
| International Releases: | October 18th, 2012 (Wide) (Australia)
October 18th, 2012 (Wide) (New Zealand) December 26th, 2012 (Wide) (United Kingdom) |
| Video Release: | October 30th, 2012 by Sony Pictures Home Entertainment |
| MPAA Rating: | R for language including some sexual references. (Rating bulletin 2214, 3/14/2012) |
| Running Time: | 85 minutes |
| Comparisons: | vs. Detention of the Dead Create your own comparison chart… |
| Keywords: | Time Travel, News, Writing and Writers, Surprise Twist, Set in Seattle, WA, Set in Washington, United States, Same Role, Multiple Actors, Adult Child Dealing with the Death of a Parent, Alternate or Altered Realities, Comedy Drama |
| Source: | Original Screenplay |
| Genre: | Comedy |
| Production Method: | Live Action |
| Creative Type: | Science Fiction |
| Production/Financing Companies: | Big Beach |
| Production Countries: | United States |
| Languages: | English |