December 9th, 2015
-1-News.jpg)
The Screen Actors Guild nominations were announced today and there are at least a few surprises to talk about. Trumbo led the way with three nominations, but there were six films with two nods apiece. Six!
More...
July 26th, 2015
There was not a single first run release among the new releases for July 7th, which meant Get Hard remained on top of the combined DVD and Blu-ray chart for July 12th. It sold an additional 268,000 units and generated $5.21 million for the week, giving it totals of 760,000 units / $13.75 million after two.
More...
July 8th, 2015
It's a slow week, which should come as no surprise. There are no major releases and even among the smaller releases, there are few that are must haves. As far as Pick of the Week contenders go, Dude Bro Party Massacre 3 is the best. It is the Pick of the Week, but you can only get it on the Official Site. I think it is worth the price for the Superfan Edition, but I also backed the Kickstarter at the Blu-ray level, so my judgment is not to be trusted.
More...
May 27th, 2015
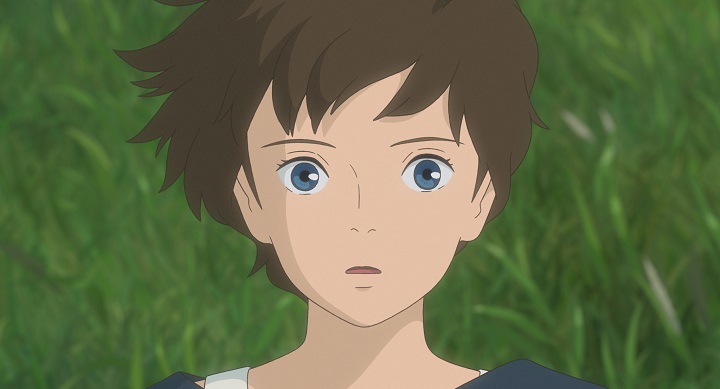
In the Name of my Daughter rose to the first place on the per theater chart with an average of $20,069 in four theaters. I'll See You in My Dreams saw its theater count expand to 26 while its average was mostly flat down to $14,593. The best new release was When Marnie Was There, which earned an average of $13,695 in two theaters. This is great for an animated film in limited release.
More...
May 12th, 2015
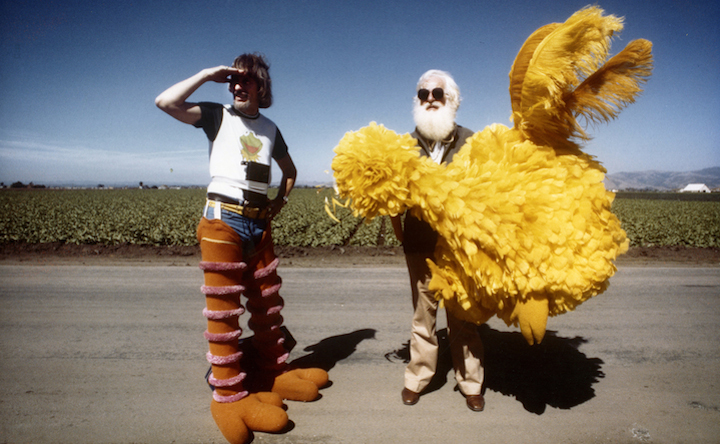
The Avengers: Age of Ultron remained in first place on the per theater chart with an average of $18,182. It wasn't the only film in the $10,000 chart this week. Pather Panchali was close behind with $16,333 in its lone theater. I Am Big Bird: The Caroll Spinney Story earned $10,150 over the weekend for a total of $13,053 from Wednesday through Sunday.
More...
April 28th, 2015
There were no films in the $10,000 club this week and no new releases really came close. The closest was Full Moon in Paris, which rose 58% from last weekend to $7,987, still in one theater. Felix et Meira was next with an average of $6,590 after expanding from one to four theaters. Don't Think I've Forgotten: Cambodia's Lost Rock and Roll was the biggest new release with an average of $6,402 in three theaters over the weekend for an average of $8,465 from Wednesday to Sunday.
More...
April 21st, 2015
Ex Machina remained in first place on the per theater chart with an average of $20,478 in 39 theaters. The only other film in the $10,000 club was Felix et Meira, which earned $15,018 in its lone theater.
More...
April 15th, 2015
Ex Machina's opening weekend was surprisingly potent earning an average of $59,316 in four theaters. This is the biggest per theater average for a film that opened in 2015. I was not expecting that. On the other hand, I was expecting Clouds of Sils Maria to do well, and it did, earning an average of $20,603 in three theaters. Furious 7 remained in the $10,000 club with an average of $14,815 in more than 4,000 theaters.
More...
April 14th, 2015
It didn't take long for for Furious 7 to become the biggest hit of the year; in fact, it took just five days to top Cinderella. Over the weekend, it became the first film released in 2015 to reach the $200 million milestone and thanks to a better than expected hold, reached $250 million as well. Home finished well back in second place, while The Longest Ride managed third place. Overall, the box office fell 42% from last weekend down to $131 million, which is 6.3% lower than the same weekend last year. Furious 7 topped Captain America: The Winter Soldier, but Rio 2 and the other films of 2014 had better depth giving 2014 the win. 2015 is still ahead in the year-to-date comparison, up 4.1% at $2.85 billion to $2.74 billion.
More...
April 7th, 2015
The overall box office leader, Furious 7, was also the leader on the per theater chart earning an average of $36,763. That's the third best average for a 2015 release, with While We're Young still earning top spot on that chart. Speaking of While We're Young, it was the only other film in the $10,000 club earning an average of $14,226 in 34 theaters. Sometime this weekend, it will have reached its first major milestone.
More...
April 7th, 2015
As expected, Furious 7 easily won the race for top spot on the weekend box office chart. However, it did so in an unexpectedly robust way, destroying a number of records along the way. This helped the overall box office grow 49% from last weekend to $224 million. More importantly, the overall box office was 34% more than the same weekend last year. Year-to-date, 2015 is now 3.1% above 2014's pace at $2.64 billion to $2.56 billion. Assuming Furious 7 has any legs at all, this lead will continue to grow next weekend.
More...
April 5th, 2015
After a massive $67.3 million on Friday, all eyes were on a $150 million weekend for Furious 7. It doesn’t look as though that is to be, with Universal projecting a weekend mark of $143,623,480 on Sunday morning. That’s the biggest April weekend of all time, and the biggest weekend outside the Summer or Thanksgiving holidays. It’s also the ninth-biggest weekend of all time, and, needless to say, franchise record. (Click here for a full list of records.) The studio will be delighted at its biggest weekend ever, and the industry as a whole will be looking forward to a lucrative Summer season with some optimism.
More...
April 3rd, 2015
It is a busy week, but not a good week for limited releases. The two biggest releases, Effie Gray and Woman in Gold, are both earning weak reviews. The film on this list I'm most interested in seeing is Cheatin'. I own a number of Bill Plympton movies / shorts and this one looks like it is worth adding to my collection.
More...