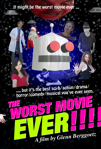
The Worst Movie EVER! (2011)

The Worst Movie EVER! poster
Theatrical Performance
Domestic Box Office $25,206Details
International Box Office $244Details
Worldwide Box Office $25,450
Further financial details...

Synopsis

A robot alien. Angst-ridden teens. Cleavage-wielding soul takers. A dark overlord. A cross-dressing retard. A pregnant 14-year-old cougar. Macho scientists. Santa Claus. Yeah, this movie has it all.

Metrics

Opening Weekend:$11 (0.0% of total gross)
Legs:11.37 (domestic box office/biggest weekend)
Domestic Share:99.0% (domestic box office/worldwide)
Theater counts:1 opening theaters/2 max. theaters, 7.0 weeks average run per theater
Infl. Adj. Dom. BO $33,472

Latest Ranking on Cumulative Box Office Lists


Movie Details

Domestic Releases: August 19th, 2011 (Limited) by Hiltz Squared
December 13th, 2013 (Limited)
MPAA Rating: Not Rated
Running Time: 76 minutes
Comparisons: vs. Gone with the Wind
Create your own comparison chart…
Keywords: Robot, Alien Invasion, Directing Yourself, Midnight Movie, Unexpected Pregnancy, Intentional B Movie
Source:Original Screenplay
Genre:Comedy
Production Method:Live Action
Creative Type:Fantasy
Production/Financing Companies: Driving With Our Eyes Shut
Production Countries: United States
Languages: English

Ranking on other Records and Milestones

RecordRankAmountChart
Date
Days In
Release
Biggest 89th Weekend Limited Release 7 $1,362 Apr 26, 2013 619
Biggest 67th Weekend Limited Release 18 $170 Nov 23, 2012 465

Compare this performance with other movies…

Domestic Cumulative Box Office Records

Weekend Box Office Performance

DateRankGross% ChangeTheatersPer TheaterTotal GrossWeek
Aug 19, 2011 131 $11   1 $11   $11 1
Oct 21, 2011 137 $12   1 $12   $323 10
Nov 11, 2011 96 $1,810   1 $1,810   $2,133 13
Dec 23, 2011 66 $1,080   1 $1,080   $3,213 19
Dec 30, 2011 70 $2,090 +94% 1 $2,090   $5,303 20
Nov 23, 2012 93 $170   1 $170   $10,194 67
Apr 26, 2013 100 $1,362   1 $1,362   $12,016 89
Nov 29, 2013 70 $1,522   1 $1,522   $15,228 120
Dec 13, 2013 58 $875   2 $438   $16,103 122
Jan 24, 2014 58 $2,216   1 $2,216   $18,319 128
Feb 28, 2014 83 $1,789   1 $1,789   $20,108 133
Mar 14, 2014 90 $902   1 $902   $21,010 135
Mar 13, 2015 87 $1,510   1 $1,510   $25,206 187

Daily Box Office Performance

DateRankGross%YD%LWTheatersPer TheaterTotal GrossDays
Aug 31, 2011 - $60     1 $60   $71 13
Oct 17, 2011 - $240     1 $240   $311 60
Nov 12, 2011 - $1,810     1 $1,810   $2,133 86
Dec 30, 2011 - $2,090     1 $2,090   $5,303 134
Apr 18, 2012 - $1,811     1 $1,811   $8,314 244
Jun 14, 2012 - $1,710     1 $1,710   $10,024 301
Nov 23, 2012 - $170     1 $170   $10,194 463
Mar 28, 2013 - $460     1 $460   $10,654 588

Weekly Box Office Performance

DateRankGross% ChangeTheatersPer TheaterTotal GrossWeek
Aug 19, 2011 138 $11   1 $11   $11 1
Aug 26, 2011 138 $60 +445% 1 $60   $71 2
Dec 23, 2011 81 $1,080   1 $1,080   $3,213 19
Jun 8, 2012 99 $1,710   1 $1,710   $10,024 43
Mar 22, 2013 117 $460   1 $460   $10,654 84
Feb 27, 2015 101 $2,686   2 $1,343   $23,696 185

Full financial estimates for this film, including domestic and international box office, video sales, video rentals, TV and ancillary revenue are available through our research services. For more information, please contact us at research@the-numbers.com.

Leading Cast

Glenn Berggoetz    Johnny, Petey, Dr. Lars Coolman

Supporting Cast

Eileen Barker    Laduelia
Stuart Goldstein    Bobby
Haidyn Janae Harvey    Erica
Bryce Foster    Brent
Christopher Irvin    Dr. Dirk Ramrod
Christine Mascolo    Angela
Kasha Fauscett    Kristin
Jeff Johnson    The Dark Overlord
Jonathan Jorgensen    Santa Cluas
Carla Cannalte    Debbie
Giovanna Leah    The Running Woman
Jeff McBride    Grocery Boy
Diane Henry    Petey's Girlfriend

For a description of the different acting role types we use to categorize acting perfomances, see our Glossary.

Production and Technical Credits

Glenn Berggoetz    Director
Glenn Berggoetz    Screenwriter
Glenn Berggoetz    Producer

Per Theater Chart: Furious Laps the Competition

April 7th, 2015

Furious 7 poster

The overall box office leader, Furious 7, was also the leader on the per theater chart earning an average of $36,763. That's the third best average for a 2015 release, with While We're Young still earning top spot on that chart. Speaking of While We're Young, it was the only other film in the $10,000 club earning an average of $14,226 in 34 theaters. Sometime this weekend, it will have reached its first major milestone. More...


  1. Summary
  2. News
  3. Box Office
  4. International
  5. Video Sales
  6. Full Financials
  7. Cast & Crew
  8. Trailer

Synopsis

A robot alien. Angst-ridden teens. Cleavage-wielding soul takers. A dark overlord. A cross-dressing retard. A pregnant 14-year-old cougar. Macho scientists. Santa Claus. Yeah, this movie has it all.

Metrics

Opening Weekend:$11 (0.0% of total gross)
Legs:11.37 (domestic box office/biggest weekend)
Domestic Share:99.0% (domestic box office/worldwide)
Theater counts:1 opening theaters/2 max. theaters, 7.0 weeks average run per theater
Infl. Adj. Dom. BO $33,472

Latest Ranking on Cumulative Box Office Lists


Movie Details

Domestic Releases: August 19th, 2011 (Limited) by Hiltz Squared
December 13th, 2013 (Limited)
MPAA Rating: Not Rated
Running Time: 76 minutes
Comparisons: vs. Gone with the Wind
Create your own comparison chart…
Keywords: Robot, Alien Invasion, Directing Yourself, Midnight Movie, Unexpected Pregnancy, Intentional B Movie
Source:Original Screenplay
Genre:Comedy
Production Method:Live Action
Creative Type:Fantasy
Production/Financing Companies: Driving With Our Eyes Shut
Production Countries: United States
Languages: English

Ranking on other Records and Milestones

RecordRankAmountChart
Date
Days In
Release
Biggest 89th Weekend Limited Release 7 $1,362 Apr 26, 2013 619
Biggest 67th Weekend Limited Release 18 $170 Nov 23, 2012 465

Leading Cast

Glenn Berggoetz    Johnny, Petey, Dr. Lars Coolman

Supporting Cast

Eileen Barker    Laduelia
Stuart Goldstein    Bobby
Haidyn Janae Harvey    Erica
Bryce Foster    Brent
Christopher Irvin    Dr. Dirk Ramrod
Christine Mascolo    Angela
Kasha Fauscett    Kristin
Jeff Johnson    The Dark Overlord
Jonathan Jorgensen    Santa Cluas
Carla Cannalte    Debbie
Giovanna Leah    The Running Woman
Jeff McBride    Grocery Boy
Diane Henry    Petey's Girlfriend

For a description of the different acting role types we use to categorize acting perfomances, see our Glossary.

Production and Technical Credits

Glenn Berggoetz    Director
Glenn Berggoetz    Screenwriter
Glenn Berggoetz    Producer

Per Theater Chart: Furious Laps the Competition

April 7th, 2015

Furious 7 poster

The overall box office leader, Furious 7, was also the leader on the per theater chart earning an average of $36,763. That's the third best average for a 2015 release, with While We're Young still earning top spot on that chart. Speaking of While We're Young, it was the only other film in the $10,000 club earning an average of $14,226 in 34 theaters. Sometime this weekend, it will have reached its first major milestone. More...

Compare this performance with other movies…

Domestic Cumulative Box Office Records

Weekend Box Office Performance

DateRankGross% ChangeTheatersPer TheaterTotal GrossWeek
Aug 19, 2011 131 $11   1 $11   $11 1
Oct 21, 2011 137 $12   1 $12   $323 10
Nov 11, 2011 96 $1,810   1 $1,810   $2,133 13
Dec 23, 2011 66 $1,080   1 $1,080   $3,213 19
Dec 30, 2011 70 $2,090 +94% 1 $2,090   $5,303 20
Nov 23, 2012 93 $170   1 $170   $10,194 67
Apr 26, 2013 100 $1,362   1 $1,362   $12,016 89
Nov 29, 2013 70 $1,522   1 $1,522   $15,228 120
Dec 13, 2013 58 $875   2 $438   $16,103 122
Jan 24, 2014 58 $2,216   1 $2,216   $18,319 128
Feb 28, 2014 83 $1,789   1 $1,789   $20,108 133
Mar 14, 2014 90 $902   1 $902   $21,010 135
Mar 13, 2015 87 $1,510   1 $1,510   $25,206 187

Daily Box Office Performance

DateRankGross%YD%LWTheatersPer TheaterTotal GrossDays
Aug 31, 2011 - $60     1 $60   $71 13
Oct 17, 2011 - $240     1 $240   $311 60
Nov 12, 2011 - $1,810     1 $1,810   $2,133 86
Dec 30, 2011 - $2,090     1 $2,090   $5,303 134
Apr 18, 2012 - $1,811     1 $1,811   $8,314 244
Jun 14, 2012 - $1,710     1 $1,710   $10,024 301
Nov 23, 2012 - $170     1 $170   $10,194 463
Mar 28, 2013 - $460     1 $460   $10,654 588

Weekly Box Office Performance

DateRankGross% ChangeTheatersPer TheaterTotal GrossWeek
Aug 19, 2011 138 $11   1 $11   $11 1
Aug 26, 2011 138 $60 +445% 1 $60   $71 2
Dec 23, 2011 81 $1,080   1 $1,080   $3,213 19
Jun 8, 2012 99 $1,710   1 $1,710   $10,024 43
Mar 22, 2013 117 $460   1 $460   $10,654 84
Feb 27, 2015 101 $2,686   2 $1,343   $23,696 185

Full financial estimates for this film, including domestic and international box office, video sales, video rentals, TV and ancillary revenue are available through our research services. For more information, please contact us at research@the-numbers.com.