Metrics
| Opening Weekend: | $30,835 (0.7% of total gross) |
| Legs: | 10.07 (domestic box office/biggest weekend) |
| Domestic Share: | 100.0% (domestic box office/worldwide) |
| Theater counts: | 3 opening theaters/206 max. theaters, 7.6 weeks average run per theater |
| Infl. Adj. Dom. BO | $15,195,305 |
Latest Ranking on Cumulative Box Office Lists
| Record | Rank | Amount |
|---|---|---|
| All Time Domestic Box Office (Rank 6,601-6,700) | 6,655 | $4,736,202 |
| All Time International Box Office (Rank 30,001-30,100) | 30,037 | $68 |
| All Time Worldwide Box Office (Rank 10,101-10,200) | 10,119 | $4,736,270 |
| All Time Domestic Box Office for Comedy Movies (Rank 1,301-1,400) | 1,342 | $4,736,202 |
| All Time International Box Office for Comedy Movies (Rank 4,601-4,700) | 4,624 | $68 |
| All Time Worldwide Box Office for Comedy Movies (Rank 2,001-2,100) | 2,017 | $4,736,270 |
| All Time Domestic Box Office for R Movies (Rank 2,301-2,400) | 2,316 | $4,736,202 |
| All Time International Box Office for R Movies (Rank 3,901-4,000) | 3,961 | $68 |
| All Time Worldwide Box Office for R Movies (Rank 2,801-2,900) | 2,810 | $4,736,270 |
See the Box Office tab (Domestic) and International tab (International and Worldwide) for more Cumulative Box Office Records.
Watch Now On
| iTunes: | iTunes, iTunes |
| Google Play: | Google Play, Google Play |
| Vudu: | Vudu |
Movie Details
| Domestic Releases: | March 2nd, 1984 (Wide) by MGM |
| International Releases: | July 2nd, 2020 (Wide) (New Zealand) |
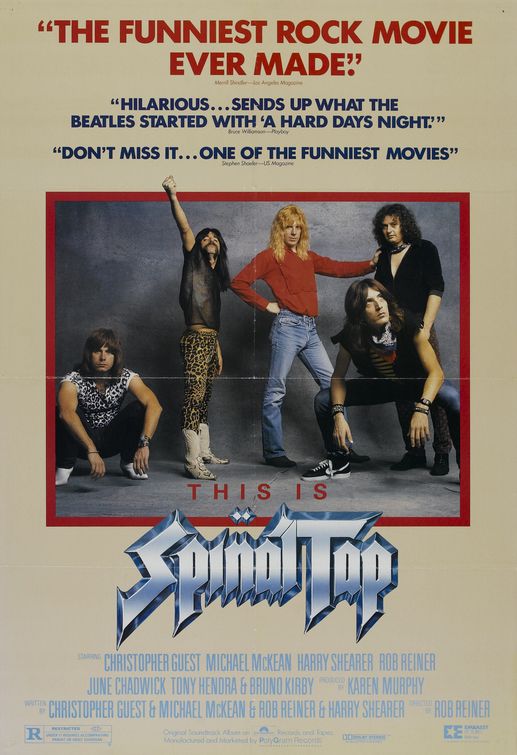
| Video Release: | July 8th, 1998 by Criterion, released as This Is Spinal Tap |
| MPAA Rating: | R |
| Running Time: | 82 minutes |
| Comparisons: | vs. The Breakfast Club Create your own comparison chart… |
| Keywords: | Mockumentary, Rock 'n' Roll, Satire, Satirical Comedy, Music Industry, Cult Movie, Ensemble, Screenplay Written By the Star, Improvised |
| Source: | Original Screenplay |
| Genre: | Comedy |
| Production Method: | Live Action |
| Creative Type: | Contemporary Fiction |
| Production Countries: | United States |
| Languages: | English |