July 29th, 2008
Another slow week without a single first run release that was a must have, or even a contender for DVD Pick of the Week. Granted, many will find Harold & Kumar Escape from Guantanamo Bay worth picking up, but it is not a top-notch release. There are also a couple of special edition releases that are easily worth picking up: Dark City - Director's Cut - Buy from Amazon: DVD or Blu-ray and WarGames - 25th Anniversary Edition. But the best of the best, and the DVD Pick of the Week is Stargate - Continuum - Buy from Amazon: DVD or Blu-ray. But I am also giving an honorable mention to Two Fat Ladies - Buy from Amazon. On a side note, it is another week where we had to split the list into two due to the size. Part II can be found here.
More...
April 1st, 2008
A mixed week when it comes to top-notch releases and there were very few that caught my eye. There are several that are worth picking up, but only Sweeney Todd: The Demon Barber of Baker Street - 2-Disc Special Edition was a contender for DVD Pick of the Week.
More...
May 8th, 2005
Golden Week helped
Shall We Dance? climb 19% to $2,250,195 for the weekend and $7,270,348 during its run. The film now has $90.3 million internationally and could break $100 million if it continues to show strong legs in Japan.
More...
May 1st, 2005
It was a good news, bad news kind of weekend for
Constantine. The film remained in top spot in Japan with $2,330,027 on 349 screens for a $9,011,671 running tally in the market. Bad news, it dropped 37% during its second weekend in the market, which is really steep for Japan. Overall the film brought in $3 million on 1,200 screens in 40 markets for a international box office of $136.4 million.
More...
March 20th, 2005
After gathering in all the data the winner for the race for fifth place is
Million Dollar Baby, I think. It would need to lost more than 40% from last week's total and that's not taking into account its openings in South Korea at $1,515,672 and second place, its $110,000, third place debut in Finland, $86,000 in Russia, $50,000, second place debut in Hong Kong. Unfortunately, exact weekend totals are unknown but it is estimated at $6 million raising its international total to $43 million so far.
More...
March 19th, 2005
Ladder 49 topped both the DVD rental charts, ($8.39 million) and the VHS rental charts ($1.61 million) for $10.00 million total rentals for its first week of release. Granted, it was a slow week for releases as no other new release made it in the top twenty on combined rentals.
More...
March 13th, 2005
Shark Tale finished its international run with a second place $2.08 million opening in Japan on 485 screens. Its $4,296 per screen average it quite low for the market and generally means the film won't have the usual legs films in Japan have. The film performed much better in Italy where it finished first again with $3.0 million, down just 23% during its sophomore stint. Overall it took in $5.2 million to raise its international total to $181 million, but without any more openings it might struggle to hit $200 million.
More...
January 8th, 2005
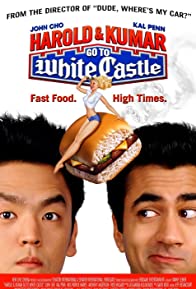
Every week films get a second chance at success from the home market; or, in some cases, a first chance at success. Here is a list of wide releases, limited releases and a few from the growing TV on DVD section, including the winner of the DVD Pick of the Week,
Harold & Kumar Go to White Castle -
Unrated Extended Edition
More...
January 3rd, 2005
I'm currently suffering from minor computer difficulties, and by minor I mean I'm writing this story on someone else's computer while I'm awaiting delivery of my new computer, which should arrive later in the week.
More...
October 13th, 2004
With openings in nearly a dozen new markets,
Shark Tale was able to take top spot on the international charts with $9.4 million in 16 markets, pushing its early total to $19.2 million internationally and over $100 million worldwide. Highlights include $4.4 million in the U.K., (including previews) and $2.05 million in Mexico. How happy the studio is with these results depends on their expectations. Compared to the average film,
Shark Tale is a massive hit. But compared to
Dreamworks previous
digitally animated film,
Shrek 2, it is a large drop.
More...
August 2nd, 2004
This weekend was another lesson in how hype can overcome bad reviews. It was also another lesson in how good reviews plus poor marketing results in a disappointing box office. Overall, the box office was again relatively flat from last weekend with just a 2.11% increase. It was up by 7.95% from last year; however, this weekend last year was the first weekend in August, so the 2003 to 2004 comparisons are not an accurate indicator. Year-to-date, 2004 continues to outpace 2003 by 6%, $5.63 billion to $5.33 billion.
More...
July 30th, 2004
We have an absolutely overloaded weekend when in comes to new releases. Four of them are opening, and at least one, and probably more, will be squeezed out.
More...
July 29th, 2004
During the past week promotional websites for several movies were launched and some older ones added additional content. Here the list of this week's releases, a couple of new sites and few updates including the winner for the week,
The Manchurian Candidate -
Official Site. If you know of any new movie websites not on this list feel free to e-mail me with the details.
More...
July 23rd, 2004
Just two wide releases this week, but unfortunately they share a lot of the same target audience. This could result in ticket splitting making both films suffer at the box office. But it is more likely that one film will simply crush the other. With the sheer contrast between their critical reception, one of them certainly deserves to crush the other.
More...
July 8th, 2004
During the past week promotional websites for several movies were launched and some older ones added additional content. Here the list of this week's releases, a couple of new sites and few updates including the winner for the week,
The Bourne Supremacy -
Official Site. If you know of any new movie websites not on this list feel free to e-mail me with the details.
More...
July 2nd, 2004
During the past week promotional websites for several movies were launched and some older ones added additional content. Here the list of this week's releases, a couple of new sites and few updates including the winner for the week,
Spider-Man 2 -
Official Site. If you know of any new movie websites not on this list feel free to e-mail me with the details.
More...
June 30th, 2004
June couldn't maintain the momentum built up at the end of May with only a few films able to match expectations. And that makes July's prospects a little less bright. Without the free advertising monster hits bring in, the industry as a whole tends to suffer. July only has one sure-fire hit, and I've already talked about it in another preview. However, there are a few others that should hit the $100 million club and maybe even one or two that will make it to $200 million.
More...
May 27th, 2004
During the past week promotional websites for several movies were launched and some older ones added additional content. Here the list of this week's releases, a couple of new sites and few updates including the winner for the week,
Baadasssss! -
Official Site. If you know of any new movie websites not on this list feel free to e-mail me with the details.
More...
May 20th, 2004
During the past week promotional websites for several movies were launched and some older ones added additional content. Here the list of this week's releases, a couple of new sites and few updates. It was another deceptively slow week as there are lots of site on the list, but none stood out as an award winning site. Many were simple placeholders, others had just minor updates, and the only three flash sites to launch were mostly marked coming soon. I was even tempted to not give out an award or maybe even bring in a
ringer. But in the end I went with
The Incredibles -
Official Site. If you know of any new movie websites not on this list feel free to e-mail me with the details.
More...
May 13th, 2004
During the past week promotional websites for several movies were launched and some older ones added additional content. Here the list of this week's releases, a couple of new sites and few updates including the winner for the week,
The Chronicles of Riddick -
Official Site . If you know of any new movie websites not on this list feel free to e-mail me with the details.
More...
May 6th, 2004
During the past week promotional websites for several movies were launched and some older ones added additional content. Here the list of this week's releases, a couple of new sites and few updates including the winner for the week,
Shrek 2 - >
Official Site. If you know of any new movie websites not on this list feel free to e-mail me with the details.
More...
February 6th, 2004
This week's new batch of movie release dates has some more shuffling around of this Summer's blockbusters, and even next Summer's blockbusters.
We also have release dates for some smaller (and more interesting) movies.
Among movies with moved dates: Welcome to Mooseport,
13 Going on 30,
Raising Helen,
Mr. 3000,
The Notebook and Shall We Dance?.
We also have a announced date for Harold & Kumar Go to White Castle, and a new name and date for the XXX Sequel.
More...