December 3rd, 2008
Thanksgiving is over and that can only mean on thing,
Christmas shopping! And that means it is time for our annual Holiday Gift Guide. This week we will look at some of the recent releases, as well as some soon to be released Blu-ray films.
More...
October 16th, 2008
We are a week away from the opening of High School Musical 3 - Senior Year, which could either be the biggest hit of the month, or a massive, massive bomb. The margin of error on all predictions it practically 100%. This should make for an interesting week when it comes to the weekly box office prediction contest. In order to win, one must simply predict the opening weekend box office of High School Musical 3 - Senior Year.
Whoever comes the closest to predicting the film's opening 3-day weekend box office (Friday to Sunday), without going over, will win a poster for Happy-Go-Lucky, Lou Reed's Berlin on DVD, Legendary Performers - Tammy Wynette on DVD, and finally Hannah Montana / Miley Cyrus - Best of Both Worlds Concert on DVD.
Meanwhile, whoever comes the closest to predicting the film's opening 3-day weekend box office (Friday to Sunday), without going under, will also win a poster for Happy-Go-Lucky, as well as Legendary Performers - Marty Robbins on DVD, and finally, Camp Rock on DVD.
Entries must be received by 10 a.m., Pacific Time on Friday to be eligible, so don't delay!
More...
September 3rd, 2008
New releases dominated this week's sales chart in a way that is rarely seen. Not only did we have a new number one, but there wasn't a single holdover in the top eight. That new number one was Camp Rock, which sold 535,000 units and generated $8.02 million in revenue. Next up was Hannah Montana/Miley Cyrus: Best of Both Worlds Concert Tour, which sold 414,000 units. However, with a higher average price it was actually the number one seller in terms of raw dollars with $9.16 million.
More...
September 3rd, 2008
New releases did well on the rental charts, but they did not dominate in the way they did on the sales chart. We still had a new number one as Street Kings topped the charts with nearly double the revenue of its nearest competitor.
More...
August 22nd, 2008
It's another A.D.K. weekend, that's After The Dark Knight, and it is really hard to get excited about any of the new releases, even if it is just to pick a target film. In the end we went with Babylon A.D., which is by far the widest release of the week, but there's no guarantee that it will be the number one film next weekend. In order to win, one must simply predict the opening weekend box office of Babylon A.D..
Whoever comes the closest to predicting the film's opening 3-day weekend box office (Friday to Sunday), without going over, will win a copy of Hannah Montana/Miley Cyrus: Best of Both Worlds Concert Tour on DVD, Camp Rock on DVD, Affinity on DVD, and Lobster Tale on DVD.
Meanwhile, whoever comes the closest to predicting the film's opening 3-day weekend box office (Friday to Sunday), without going under, will also win a copy of Affinity on DVD, and Lobster Tale on DVD, as well as The Blue Elephant on DVD.
Entries must be received by 10 a.m., Pacific Time on Friday to be eligible, so don't delay!
More...
August 18th, 2008
This is the week that Hannah Montana/Miley Cyrus: Best of Both Worlds Concert Tour makes its debut on DVD and Blu-ray. This movie was a huge hit theatrically, so it will be interesting to see how well it sells on the home market. However, while it is certainly a very good deal, I'm not sure it is a real contender for DVD Pick of the Week. For that we have to look to Terminator - The Sarah Connor Chronicles on either DVD or Blu-ray, but there are also a few other releases worth checking out. There are are plenty of other releases, so much so that we had to split this week's list into two. Look for part I here.
More...
August 18th, 2008
This is the week that Hannah Montana/Miley Cyrus: Best of Both Worlds Concert Tour makes its debut on DVD and Blu-ray. This movie was a huge hit theatrically, so it will be interesting to see how well it sells on the home market. However, while it is certainly a very good deal, I'm not sure it is a real contender for DVD Pick of the Week. For that we have to look to Terminator - The Sarah Connor Chronicles on either DVD or Blu-ray, but there are also a few other releases worth checking out. There are are plenty of other releases, so much so that we had to split this week's list into two. Look for part II here.
More...
April 16th, 2008
The Visitor opened in first place on the Per Theater Chart with an average of $21,622 in 4 theaters, which bodes very well for this Friday's expansion. Young @ Heart scored second place with an average of $12,734 over the weekend and $15,558 from Wednesday to Sunday. The final film in the $10,000 club was Flight of the Red Balloon, which was down 32% to $11,959. The closest film to $10,000 that didn't make was Hannah Montana/Miley Cyrus: Best of Both Worlds Concert Tour with $8,424, which is that film's best per theater average since its second week of release.
More...
March 30th, 2008
The latest Indian movie to be released on the worldwide stage was Race, which earned $9.90 million on 1212 screens in 16 markets placing sixth on the international charts. It did very well in India, but exact numbers were not released.
More...
March 23rd, 2008
No Country For Old Men remained in sixth place with $4.92 million on 1660 screens in 44 markets for a total of $68.25 million. The film ended its international run in Japan where it earned $492,000 on 41, but it missed the top ten there. Perhaps it can expand there.
More...
February 20th, 2008
The streak is over. For the first time in a while we saw decline on the year-to-year comparison. In fact, it wasn't even close as the overall box office earned $136 million over three days and $165 million over four. In both cases this represents double-digit declines, but 2008 is still leading 2007 by 11%, $1.29 billion to $1.16 billion.
More...
February 12th, 2008
Three films earned per theater averages better than $10,000 this weekend. Two of those were the same 3D concert releases that topped the charts last week. However, the number one film this week was In Bruges with a very healthy average of $16,330 in 28 theaters. Hannah Montana/Miley Cyrus: Best of Both Worlds Concert Tour did suffer a sophomore slump, but earned an average of $14,987, which is more than enough to keep theater owners happy. Finally, U2 3D was up more than 3% to $12,094, which bodes very well for the film's upcoming expansion.
More...
February 12th, 2008
Results over the weekend were mixed with the number one film opening above expectations by a small degree, but the top five weaker than predicted. This led to the overall box office coming in at just over $112 million, which is down 12% from last weekend. However, it is virtually tied with the same weekend last year. (It is currently down by less than $200,000, but that could change as some independent films finalize their weekend figures and release the numbers later this week.) If late returns can't make up the difference, 2008's winning streak will be over, but it is still up 15% over 2007, which is a huge margin.
More...
February 7th, 2008
We have two wide releases this week, Fool's Gold and Welcome Home Roscoe Jenkins, but we could have a repeat champion atop the box office as Hannah Montana/Miley Cyrus: Best of Both Worlds Concert Tour has proven strong during the week thus far.
More...
February 5th, 2008
Only two films topped $10,000 on the Per Theater Chart, and both of them were 3D concert releases. Hannah Montana/Miley Cyrus: Best of Both Worlds Concert Tour led the way with a record-setting average of $45,561, which is the most earned by any film playing in more than 100 theaters.
U2 3D also topped $10,000 with $11,720, which was down just over 25% and that bodes well for its expansion next week.
More...
February 5th, 2008
The New York Giants stopped the Patriots from completing a perfect season.
However, from where I'm sitting, this isn't the biggest news of the weekend. Multiple records were broken by Hannah Montana/Miley Cyrus: Best of Both Worlds Concert Tour. This helped the overall box office hit $128 million over the weekend, which is down 10% from last weekend, but this is reasonable considering this is a post-holiday weekend and Super Bowl Weekend. More importantly, the overall box office was up 40% from the same weekend in 2007, and 2008 is off to an early 16% lead from last year.
More...
February 2nd, 2008
Like most weeks this year, I was not wowed by any of the sites for this week's releases. Most could not rise above effective or average. Hopefully this trend will change soon as we get out of the early year doldrums.
More...
February 1st, 2008
2008 got off to a faster than expected start with January helping the year to a 17.5% lead over 2007. It seems unlikely that February will be able to keep up that pace, but there are still enough releases that most avid moviegoers should find something to get excited about. Granted, this is partially due to the combination of the lead year and February 29th landing on a Friday. This means we have five weekends in February this year, something that only happens approximately once every 28 years, which explains the number of films.
More...
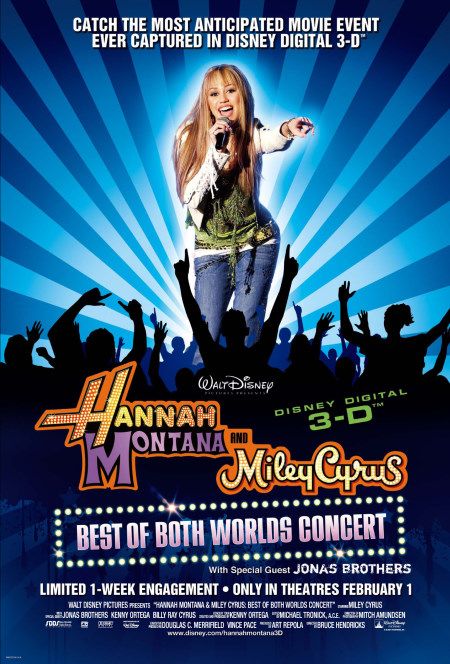
February 1st, 2008
February starts off with what could be the most unlikely of box office hits in Hannah Montana/Miley Cyrus: Best of Both Worlds Concert Tour. It isn't the only new release this week, but it is looking very likely that it will be the strongest. Granted, a lot of this has to due with Super Bowl Sunday, which siphons off a lot of potential moviegoers, especially the younger male demographic.
More...
December 18th, 2007
This week another number of upcoming movies, new stars and directors have been added to our archive!
More...
December 16th, 2007
This week's round of new movie release information contains not only the general weekly update, but also an a number of release updates we had missed earlier.
More...