May 25th, 2010
Solitary Man led the way on the per theater chart with nearly $100,000 in 4 theaters for an average of $23,734. Placing second was Shrek Forever After, as the overall box office leader earned an average of $16,251. Holly Rollers opened with $40,000 in 3 theaters for an average of $13,228. The final film in the $10,000 club was The Father of My Children, which opened with $10,414 in one theater.
More...
March 16th, 2010
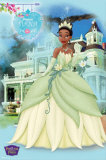
Not a big week in terms of total releases, but there are plenty of top-notch choices from every category. The best wide release on this week's list is The Princess and the Frog, which is a contender for Pick of the Week. It's not the only contender for that title. In fact, there are contenders in nearly every category, including limited releases (Bandslam on DVD), Foreign Language films (Broken Embraces on Blu-ray), TV on DVD (Breaking Bad: The Complete Second Season on Blu-ray), and even Canadian (High Life on DVD). While all are worthy of adding to your DVD / Blu-ray collection, I'm going with The Princess and the Frog on Blu-ray / DVD Combo Pack as the Pick of the Week.
More...
February 2nd, 2010
Saint John of Las Vegas rode an impressive cast to the top of the per theater chart with an average of $10,833, but given its reviews, I don't think it will stick around much longer. On the other hand, Avatar has been on this list for seven weeks now earning an average $10,176 this past weekend. However, unless the Oscar nominations help it at the box office, this will be the last time it appears on this list.
More...
January 20th, 2010
The Last Station started its run on top of the per theater chart with an average of $24,574 in three theaters, which was nearly double its nearest competitor. That film was Crazy Heart, which remained in second place with an average of $13,776. That was a decline of just 1.6% from last weekend despite some significant expansion. With a couple of Golden Globe wins, there's little doubt it will remain in theaters for some time to come.
Fish Tank was in a virtual tie with an average of $13,750 in two theaters; in fact, since that is still an estimate, it might climb into second place.
On the other hand, since Avatar was right behind with $13,025, it could slip a spot.
The final film in the $10,000 club was The Book of Eli with an average of $10,540, which was better than expected.
More...
January 5th, 2010
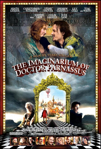
The Imaginarium of Doctor Parnassus topped the per theater chart this weekend, based on reports from theaters in the United States.
The film earned $128,000 in 4 theaters for an average of $31,909, which is roughly what it made last weekend.
It is also playing in many more theaters in Canada, but numbers have not been reported from those locations, at least so far this week.
The final figures may therefore, as last week, push the final average down considerably.
Second place went to to Lovely Bones, which climbed more than 54% to an average of $21,559 in three theaters.
This is excellent news for its planned expansion in a couple of weeks, assuming it doesn't fall by the same amount next week.
White Ribbon opened next with an average of $19,949, also in three theaters.
The overall number one film, Avatar, was just a fraction behind, earning an average of $19,789.
At this point, we've nearly run out of superlatives to describe the film's box office run and it is far from over.
Crazy Heart saw growth over the weekend, up 38% to an average of $18,416.
3 Idiots expanded somewhat and earned a very impressive average of $11,322 in 132 theaters.
A Single Man returned to the $10,000 club with an average of $10,586 in 46 theaters.
The final film in the $10,000 club was Sherlock Holmes, which fell sharply but still managed an average of $10,097.
More...
December 29th, 2009
As it did on the overall chart, Avatar led the way on the per theater chart, earning an average of $21,880.
Second place went to the overall second place film, Sherlock Holmes, which pulled in an average of $18,031.
3 Idiots did something most Bollywood films don't manage to do, namely top $10,000 on the per theater chart.
Additionally, it was a wider release than most of its compadres, which makes this opening even more impressive.
Crazy Heart expanded somewhat, but still remained strong with an average of $13,321 and this makes hitting milestones much more likely.
Alvin and the Chipmunks: The Squeakquel was the third wide release to crack $10,000 with an average of $13,210.
Finally we get to Lovely Bones, which is down to an estimated average of $12,667.
This is roughly a third of its opening weekend average and it still hasn't expanded, which doesn't bode well.
More...
December 16th, 2009
The Hollywood Foreign Press Association announced their nominations this week, but looking over the list of films chosen, it is hard to declare any one film as the big winner. Up in the Air did pick up six Golden Globe nominations, including several of the most prestigious nominations, but it is far from the only major player.
More...
December 15th, 2009
Lovely Bones defied critics to open on top of the per theater chart with $38,872 in three theaters.
Up in the Air remained in second place with an average of $33,255 in 72 theaters, while it nearly reached the top ten on the overall chart.
A Single Man opened with more than $200,000 in 9 theaters for an average of $24,148.
Broken Embraces spent its fourth weekend in the $10,000 club with an average of $18,255 in six theaters.
It is starting to expand, so it should start hitting major milestones soon.
More...
December 9th, 2009
Fewer films reached the $10,000 mark on the per theater chart this weekend than last weekend.
The Princess and the Frog, saw its per theater average drop a minuscule 5% to $373,855, which likely represents nearly universal sellouts throughout the weekend in both theaters.
Second place went to Up in the Air with an average of $78,763 in 15 theaters.
That is an impressive start and with the film already proving itself to be an Awards Season player, its future is indeed bright.
Broken Embraces continues to perform in limited release and earned an average of $44,285 in two theaters, but it better expand fast before momentum is lost.
Mystery Team was a surprise entry in the $10,000 club earning a reported $11,259 in one theater.
More...
December 1st, 2009
There were more than half-a-dozen films to top $10,000 on the per theater chart, including The Princess and the Frog, which earned close to $800,000 in just two theaters for an average of $393,095. Broken Embraces saw its per theater average rise by more than 10% to $58,993, which bodes well for its chances to expand. Next up was Me and Orson Welles with an average of $15,910 in 4 theaters, while The Road opened with $1.5 million in 111 theaters for an average of $13,534. A trio of top ten moves rounded out the $10,000 club with The Blind Side earning an average of $12,774, Precious took in an average of $10,680, and finally The Twilight Saga - New Moon was right behind with $10,606.
More...
November 29th, 2009
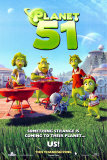
Planet 51 started its international run in a limited fashion, but was only a little better than its domestic opening. Its biggest market was Russia, where it placed fourth with $1.49 million on 344 screens, which is on par with its opening here, perhaps a little bit stronger.
The film also placed fourth in Italy with $1.16 million on 255 screens, which is again on par with the US, but perhaps a little weaker.
Overall, it landed in sixth place with $3.22 million on 894 screens in 6 markets during its opening weekend, but should improve this weekend when it opens in Spain, Mexico, and Brazil.
More...
November 24th, 2009
Broken Embraces opened on top of the per theater chart with an impressive average of $53,556 in two theaters, while The Fantastic Mr. Fox was in a close second place with an average $50,878 in four theaters. The overall box office leader, The Twilight Saga - New Moon, placed third with $35,497 in more than 4,000 theaters. Precious saw its best numbers of its run so far, pulling in nearly $11 million in just over 600 theaters for an average of $17,300. The Sun opened with $11,588 in one theater while The Blind Side opened with an average of $10,971 in more than 3,000 theaters.
More...
November 22nd, 2009
The Imaginarium of Doctor Parnassus climbed into sixth place with $3.20 million on 764 screens in 6 markets for a total of $21.40 million after a month of release. The film opened in fifth place in France with $2.14 million on 234 screens, but that was for the full week. It cracked $10 million in Italy during its run with a total of $10.36 million, including $861,000 on 247 screens this past weekend.
More...
November 22nd, 2009
After enjoying impressive box office and home market sales over the last year for Twilight, the industry knew that Summit had a potential blockbuster franchise on its hands.
This weekend has proved that they have a franchise as big as anything else in the industry.
The Twilight Saga: New Moon opened on Friday with an extraordinary estimated $72.7 million, the biggest single day in box office history (see list).
And, while it couldn't quite maintain that pace through the entire weekend, the studio reported a final weekend estimate of $140.7 million this morning, the third-biggest weekend of all time (see list).
More...
November 20th, 2009
Normally it is very hard for a limited release to score breakout success.
On a typical weekend, none of the films opening in exclusive engagements go on to a real measure of mainstream success.
However, this week there are three films that could be able to do just that: Bad Lieutenant - Port of Call New Orleans, Broken Embraces, Red Cliff.
It will be interesting to see which one manages to be the biggest of the three.
More...