April 1st, 2010
Not only did eight new releases reach the top 30 on this March 14's sales chart, but they were very top-heavy on the chart, taking the top three spots and six of the top seven. The new number one DVD was Precious with 726,000 units sold and $12.34 million in consumer spending at retail during its first week of release.
More...
March 9th, 2010
We have a pair of Awards Season players coming out this week. I was supposed to review both Precious and Up in the Air, but they ran out of screeners for the latter. Because of that, it is hard for me to say which one is more deserving of the Pick of the Week honors, so I'm going to award that title to both of them. That said, while the DVD and the Blu-ray for Precious are worth picking up, the Up in the Air Blu-ray is too expensive compared to the DVD.
More...
March 7th, 2010
The Oscars are being handed out as we speak and I will be updating our list of nominees with some of the winners as they happen. So far we've seen a few awards handed out, but no surprises.
More...
March 7th, 2010
The Numbers' annual Oscar polls have proved to be remarkably accurate predictors of
the final results on Oscar night.
We call results based on the hundreds of The Numbers readers who vote in our
Predict the Oscars competition.
We've received all the votes now, and are ready to make predictions in all categories.
Percentage figures are the percentage of The Numbers readers who believe a movie or performance
will win.
They are a rough guide to how likely a particular movie is to win in a category.
More...
March 7th, 2010
Precious was filmed in late 2007 on a small budget with mostly unknown actors in the key roles. It was based on a script by a screenwriter with no other credits and directed by a director whose only previous film was panned by critics and mostly ignored by moviegoers. When the film opened at Sundance Film Festival, it didn't have high expectations for box office success. But right from the start the critical response was amazing and the buzz started to grow. By the time the film opened in limited release, the buzz had reached a crescendo, helping it break records during its opening weekend while it earned numerous nominations during Awards Season, including six Oscars On Friday it won five Independent Spirit Awards. The expectations for this film couldn't be higher.
More...
March 6th, 2010
With our annual Oscar Prediction contest underway, now is the best time to look at the nominees and try and figure out who the favorites are and which films should just feel honored to be nominated. Today we look at Best Picture and we actually have a real race in this category.
More...
March 6th, 2010
With our annual Oscar Prediction contest underway, now is the best time to look at the nominees and try and figure out who the favorites are and which films should just feel honored to be nominated. Today we look at Best Director and we actually have a real race in this category.
More...
March 5th, 2010
While the Independent Spirit Awards are one of the first to announce their nominations, they are one of the last to hand out the awards. This year the clear winner was Precious, which swept all five categories it was nominated for. However, it wasn't the only winner.
More...
March 5th, 2010
With our annual Oscar Prediction contest underway, now is the best time to look at the nominees and try and figure out who the favorites are and which films should just feel honored to be nominated. Today we look at Best Actress in a Lead Role, which, unlike many others, I don't think is a slam dunk.
More...
March 5th, 2010
With our annual Oscar Prediction contest underway, now is the best time to look at the nominees and try and figure out who the favorites are and which films should just feel honored to be nominated. Today we look at Best Supporting Actress, which is not a very competitive category.
More...
March 4th, 2010
With our annual Oscar Prediction contest underway, now is the best time to look at the nominees and try and figure out who the favorites are and which films should just feel honored to be nominated. Today we look at Best Adapted Screenplay, which is one of the categories that I think could give us a surprise.
More...
February 14th, 2010
For the first time during its international run, Alvin and the Chipmunks 2: The Squeakquel missed the top five and placed sixth with $7.10 million on 3,699 screens in 42 markets for a total of $200.87 million internationally and $413.03 million worldwide.
With no major market openings left, the film will likely fall further down the chart over the coming weeks, but it has already made a huge profit, so Fox will be more than happy.
More...
February 2nd, 2010
Oscar nominations were announced at 5:38 this morning, continuing a tradition that have never been adequately explained to me. (Why so early in the morning? Does earning an Oscar nomination become sweeter if people have to wake you up to congratulate you?) Leading the way in nominations were Avatar and The Hurt Locker, both of which pick up nine nods each, many of them in the same categories.
More...
January 26th, 2010
Crazy Heart climbed to first place on the per theater chart with an average of $14,551 in 93 theaters. I think you could officially say it is earning some measure of mainstream success, while further wins during Awards Season will only help it grow. The Last Station slipped to second with an average of $12,409, but it also more than doubled its theater count, which is a good sign moving forward. Avatar was the only other film to top $10,000 on the per theater chart, earning an average of $11,125 in more than 3,000 theaters.
More...
January 25th, 2010
The Directors Guild of America release their nominations over three days stretched out over a week. Only two of the nominations are for theatrical releases, but at least the documentary category had some interesting nominees. On the other hand, Feature Film merely enforces the trends we've seen throughout Awards Season.
More...
January 24th, 2010
There were few surprises when the SAG awards were handed out this weekend, and no film dominated the night.
Only one film, Inglourious Basterds, won more than one award, while most of the winners lined up with those handed out at other awards ceremonies so far this season.
More...
January 17th, 2010
Some might debate the predictive value of The Golden Globes.
After all, they don't have all of the same categories as the Oscars, and the results for Best Picture in particular have varied from the Oscar result many times over the years.
However, it is hard to argue with the free publicity a film gets from winning, and the big winner tonight was Avatar.
More...
January 12th, 2010
The WGA announced their nominations this week, which include eleven awards, three of which are for theatrical releases.
More...
January 6th, 2010
The Producers Guild of America announced their nominations this week, and while there are only three categories for theatrical releases, they tend to be quite accurate predictors for the Oscar nominations.
This is great news for Up, which picked up nominations in two of the three categories.
More...
December 22nd, 2009
Like last week, the number one film on the per theater chart managed that feat despite mixed reviews.
This week it was Nine, which opened with an average of $64,308, but I am concerned about its ability to expand, especially if its word-of-mouth match its reviews.
The number one film on the overall chart, Avatar, placed second with $22,313 while Crazy Heart was not that far behind with an average of $20,666.
Up in the Air's expansion continues but it remained strong on the per theater chart with an average of $18,344 in 175 theaters.
Finally, Lovely Bones saw its average plummet this weekend to $15,032, which is more than 60% lower than last weekend.
Had this been accompanied by an expansion this wouldn't be an issue, but it is still playing in just three theaters.
More...
December 17th, 2009
The SAG nominations were announced this week, and the trend of the year continues with Up in the Air leading the way, but no one film dominating. This time around Up in the Air was in a three-way tie with Inglourious Basterds and Precious, which makes the race even more interesting.
More...
December 16th, 2009
The Hollywood Foreign Press Association announced their nominations this week, but looking over the list of films chosen, it is hard to declare any one film as the big winner. Up in the Air did pick up six Golden Globe nominations, including several of the most prestigious nominations, but it is far from the only major player.
More...
December 9th, 2009
Fewer films reached the $10,000 mark on the per theater chart this weekend than last weekend.
The Princess and the Frog, saw its per theater average drop a minuscule 5% to $373,855, which likely represents nearly universal sellouts throughout the weekend in both theaters.
Second place went to Up in the Air with an average of $78,763 in 15 theaters.
That is an impressive start and with the film already proving itself to be an Awards Season player, its future is indeed bright.
Broken Embraces continues to perform in limited release and earned an average of $44,285 in two theaters, but it better expand fast before momentum is lost.
Mystery Team was a surprise entry in the $10,000 club earning a reported $11,259 in one theater.
More...
December 2nd, 2009
As always, the Independent Spirit Awards represent the unofficial start of Awards Season with the announcement of their nominations.
This year The Last Station and Precious topped the list of nominees with five each.
For the former, it should help build buzz for its 2010 release.
For the latter, it is the first step towards possible Awards Season glory and further enhances its already lofty box office potential.
More...
December 1st, 2009
There were more than half-a-dozen films to top $10,000 on the per theater chart, including The Princess and the Frog, which earned close to $800,000 in just two theaters for an average of $393,095. Broken Embraces saw its per theater average rise by more than 10% to $58,993, which bodes well for its chances to expand. Next up was Me and Orson Welles with an average of $15,910 in 4 theaters, while The Road opened with $1.5 million in 111 theaters for an average of $13,534. A trio of top ten moves rounded out the $10,000 club with The Blind Side earning an average of $12,774, Precious took in an average of $10,680, and finally The Twilight Saga - New Moon was right behind with $10,606.
More...
November 24th, 2009
Broken Embraces opened on top of the per theater chart with an impressive average of $53,556 in two theaters, while The Fantastic Mr. Fox was in a close second place with an average $50,878 in four theaters. The overall box office leader, The Twilight Saga - New Moon, placed third with $35,497 in more than 4,000 theaters. Precious saw its best numbers of its run so far, pulling in nearly $11 million in just over 600 theaters for an average of $17,300. The Sun opened with $11,588 in one theater while The Blind Side opened with an average of $10,971 in more than 3,000 theaters.
More...
November 23rd, 2009
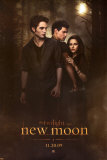
New Moon broke all manner of records over the weekend, which was great news for Summit, and for the industry as a whole.
New Moon made more all by itself than all other movies combined pulled in last weekend and the overall box office was $259 million, the second biggest weekend on record.
Compared to last week, we saw a 85% increase, while compared to the same weekend last year, 2009 grew by 57%.
Year-to-date, 2009 has now pulled in $9.20 billion, which is just shy of 8.0% higher than last year's pace.
Additionally, it is just ahead of 2002's final tally, making 2009 the sixth biggest year so far, and we have more than a full month ahead, including two major holidays.
Simply amazing.
More...
November 22nd, 2009
After enjoying impressive box office and home market sales over the last year for Twilight, the industry knew that Summit had a potential blockbuster franchise on its hands.
This weekend has proved that they have a franchise as big as anything else in the industry.
The Twilight Saga: New Moon opened on Friday with an extraordinary estimated $72.7 million, the biggest single day in box office history (see list).
And, while it couldn't quite maintain that pace through the entire weekend, the studio reported a final weekend estimate of $140.7 million this morning, the third-biggest weekend of all time (see list).
More...
November 19th, 2009
This could be a surprising weekend at the box office, as the buzz for New Moon has hit new heights of insanity.
There's no doubt that it will be the number one film of the weekend, and almost no doubt that it will top Twilight, which was the number one film this week last year.
It appears the only real question is how many records can it break along the way.
More...
November 17th, 2009
We have a new champion on the Per Theater Chart with The Fantastic Mr. Fox leading the way with an average of $66,475 in four theaters.
Precious expanded into more than 100 additional theaters but still pulled in an amazing average of $33,762, which was enough for second place.
La Danse climbed to $28,104, while playing again in a single theater (albeit now on two screens).
The overall box office leader, 2012, opened with an average of $19,165 in just over 3,400 theaters.
Uncertainty only earned mixed reviews, but it scored $13,075 in its lone theater.
The End of Poverty? was richly rewarded with $12,593 in its solitary theater.
Two other new releases were neck-and-neck with Four Season Lodge earning $11,667 while The Messenger managed an average of $11,131.
More...
November 16th, 2009
Great news at the box office, as the number one film topped expectations by a significant margin.
In fact, the top three films all did much better than expected.
On the down side, the rest of the films we talked about on Thursday struggled and this hurt the overall box office.
The total take was up 16.9% from last weekend at $140 million, but this was 5.8% lower than the same weekend last year.
Year to date, 2009 has pulled in $8.91 billion, which is 7.0% higher than last year's pace, and by this time next week 2009 will be only the seventh year to cross $9 billion in total ticket sales.
More...
November 12th, 2009
Just the one truly wide release this week, but we also have a semi-wide release that could sneak its way into the top ten, as well as a limited release that is expanding.
That wide release, 2012, is a disaster flick, which might be the best word to describe the overall box office, at least compared to last year.
Very few people think 2012 will top the $67.5 million opening of Quantum of Solace, which debuted this weekend last year.
In fact, if it misses that mark by a mere $10 million, I think a lot of people will be pleasantly surprised, while if it is short by $20 million or more, not too many people will be shocked.
Additionally, the holdovers are going to get crushed in this comparison as well, so there is almost no chance that 2009 will come out ahead.
It's a matter of minimizing the damage.
More...
November 10th, 2009
Precious had a record-breaking opening on the per theater chart with close to $1.9 million in just 18 theaters for an average of $104,025.
This is just shy of the record for best per theater average for a live action movie; however, the current record holder, Dreamgirls, opened in fewer theaters and with prestige pricing, so this is arguably the better result.
Precious did set the record for highest per theater average for a film playing in more than 10 theaters.
It wasn't the only film in the $10,000 club with La Danse earning $14,000 in its lone theater while Splinterheads opened with $10,515, also in one theater.
More...
November 8th, 2009
Disney's A Christmas Carol got off to a disappointing start over the weekend, according to studio estimates.
While a $31 million debut is nothing to sniff at, it's well below expectations and might leave the movie outside the top 50 November weekends (see list).
This might be a case of opening a Christmas movie too soon, and Disney will be looking for long legs through Thanksgiving and into the Holiday Season proper, so all is not lost yet, but the next couple of weeks will be key.
More...
November 6th, 2009
With the beginning of November comes the start of Awards Season, so we should be seeing more and more potential Awards Season players coming out over the coming weeks. However, while there is one such release this week, Precious, it is overshadowing all of the other new releases.
More...
November 1st, 2009
October was not a month to remember, as only two films really beat expectations. (Although Paranormal Activity was the most unexpected hit during the October, it actually opened in September, so one could argue it's not really an 'October hit'.) This month we have a massive collection of potential blockbusters, some potential Oscar contenders, as well as a few unfortunate films that might be squeezed out by the competition. Compared to last November, we might have the same number of $100 million hits, assuming all movies match expectations (fat chance); we have a limited release from this month become the Awards Season darling and reach that milestone (monstrously unlikely); and we count The Princess and the Frog as a November releases (intellectually dishonest). That said, if three or four legitimate November releases reach that milestone, then 2009 will be on pace to tie or break the record for most $100 million released in one calendar year. But overall, 2009 will likely see its lead over 2008 shrink during the next 30 days.
More...