April 1st, 2010
Not only did eight new releases reach the top 30 on this March 14's sales chart, but they were very top-heavy on the chart, taking the top three spots and six of the top seven. The new number one DVD was Precious with 726,000 units sold and $12.34 million in consumer spending at retail during its first week of release.
More...
March 14th, 2010
The Princess and the Frog remained in sixth place with $5.18 million on 3019 screens in 35 markets for a total of $149.82 million internationally and $253.53 million worldwide. This past week it opened in Japan, struggling into fifth place with $1.02 million on 363 screens. Even with that disappointing result, it should do well enough on the home market to show a profit relatively soon.
More...
March 9th, 2010
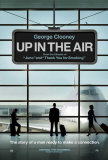
We have a pair of Awards Season players coming out this week. I was supposed to review both Precious and Up in the Air, but they ran out of screeners for the latter. Because of that, it is hard for me to say which one is more deserving of the Pick of the Week honors, so I'm going to award that title to both of them. That said, while the DVD and the Blu-ray for Precious are worth picking up, the Up in the Air Blu-ray is too expensive compared to the DVD.
More...
March 7th, 2010
The Princess and the Frog may have slipped out of the top five internationally, but it still added $8.32 million on 3053 screens in 28 markets for a total of $143.18 million. It had no major market openings again this week, but it added $2.84 million on 689 screens over the weekend in France for a total of $27.30 million after a month of release there. This weekend the film debuted in Japan, which could help it return to the top five. Regardless, it has made enough money that it should show a profit, eventually.
More...
March 7th, 2010
The Numbers' annual Oscar polls have proved to be remarkably accurate predictors of
the final results on Oscar night.
We call results based on the hundreds of The Numbers readers who vote in our
Predict the Oscars competition.
We've received all the votes now, and are ready to make predictions in all categories.
Percentage figures are the percentage of The Numbers readers who believe a movie or performance
will win.
They are a rough guide to how likely a particular movie is to win in a category.
More...
March 6th, 2010
With our annual Oscar Prediction contest underway, now is the best time to look at the nominees and try and figure out who the favorites are and which films should just feel honored to be nominated. Today we look at Best Picture and we actually have a real race in this category.
More...
March 6th, 2010
With our annual Oscar Prediction contest underway, now is the best time to look at the nominees and try and figure out who the favorites are and which films should just feel honored to be nominated. Today we look at Best Director and we actually have a real race in this category.
More...
March 5th, 2010
With our annual Oscar Prediction contest underway, now is the best time to look at the nominees and try and figure out who the favorites are and which films should just feel honored to be nominated. Today we look at Best Actor in a Lead Role, which is yet another category with a runaway favorite.
More...
March 5th, 2010
With our annual Oscar Prediction contest underway, now is the best time to look at the nominees and try and figure out who the favorites are and which films should just feel honored to be nominated. Today we look at Best Supporting Actress, which is not a very competitive category.
More...
March 4th, 2010
With our annual Oscar Prediction contest underway, now is the best time to look at the nominees and try and figure out who the favorites are and which films should just feel honored to be nominated. Today we look at Best Adapted Screenplay, which is one of the categories that I think could give us a surprise.
More...
February 28th, 2010
Shutter Island started its international run with a sixth place finish this past weekend, earning $9.28 million on 1229 screens in 9 markets. The film opened in first place in Spain with $3.25 million on 406 screens. It had to settle for second place in Australia, in a virtual tie with Valentine's Day at $2.50 million on 250 screens. It's way too early to tell where the film will end up, but matching its domestic run internationally is a solid goal.
More...
February 21st, 2010
The WGA announced their winners today, which include three categories for theatrical releases.
More...
February 21st, 2010
As expected, The Princess and the Frog reached $100 million internationally just before the weekend started, ultimately overtaking its domestic total. It had no major market openings over the past weekend, but it managed to rise to first place in France with $4.09 million on 697 screens for a total of $17.31 million after three. It also remained solid in the U.K., adding $2.36 million on 501 screens for a total of $6.58 million. Overall, it pulled in $11.29 million on 3349 screens in 34 markets for a total of $111.94 million internationally and $213.69 million worldwide.
More...
February 10th, 2010
Avatar's legs on the international scene are as strong as they come.
It remained in first place for the eighth weekend in a row, this time down just 17% to $79.44 million on 10,298 screens in 94 markets for a total of $1.59 billion internationally and $2.21 billion worldwide.
Japan was added to the list of markets where the film has hit the century mark with $108.04 million, including $6.41 million on 650 screens this weekend.
Other results of note came in the U.K, where it became the biggest hit of all time, at least in terms of British Pounds.
In American Dollars, the film has $112.19 million after making $6.77 million on 417 screens this weekend.
Additionally, we can now report that China has overtaken France as the film's most lucrative market, leading now by $144.4 million to $141.4 million.
This is not only big new for this film, but huge news for the industry as a whole.
China is now a major player at the international box office, both as a consumer and also as a producer.
More...
February 3rd, 2010
It was another milestone weekend for Avatar as it became the first film to ever reach $2 billion worldwide.
It did so despite falling below $100 million over the weekend for the first time during its run.
That said, it still pulled in an incredible $95.44 million on 11,088 screens in 84 markets for a total of $1.45 billion internationally and $2.05 billion worldwide.
Its biggest market was Italy where it added $10.38 million on 800 screens over the weekend for a total of $52.94 million after three.
Its best market overall remains France where it has $133.9 million, but China is catching up with $126.3 million.
The film also reached the century mark in the U.K. with $103.52 million, including $7.74 million on 424 screens over the weekend and in Germany with $102.03 million including $7.88 million on 599 screens.
It may have already gotten there in Russia, while it is about a week away from that milestone in Japan, Australia, South Korea.
Additionally, it looks like it is just a matter of time for Spain and Italy.
That would be ten markets with $100 million or more, to go with the countless other records the film has already set.
The next major milestone is $1.84 billion internationally, which is what Titanicmade worldwide.
And with its impressive list of Oscar nominations, $2 billion internationally becomes a lot more likely.
And who knows, perhaps even $3 billion worldwide?
We are dealing with unprecedented numbers, so the usual rules about Oscar bounces just don't apply.
Winning could result in a flood at the box office, or its publicity could be at saturation levels already and it won't have a major effect.
More...
February 2nd, 2010
Oscar nominations were announced at 5:38 this morning, continuing a tradition that have never been adequately explained to me. (Why so early in the morning? Does earning an Oscar nomination become sweeter if people have to wake you up to congratulate you?) Leading the way in nominations were Avatar and The Hurt Locker, both of which pick up nine nods each, many of them in the same categories.
More...
January 27th, 2010
As expected, Avatar became the highest grossing film on the international chart over the weekend while it had to wait until Monday to do the same worldwide. Over the weekend, it made $108.27 million on 11,925 screens in 94 markets for a total of $1.29 billion internationally and $1.84 billion worldwide, as of Sunday night. The film had already crossed $100 million France, while it did the same in China with $102.3 million, including $11.7 million on 1,013 screens this past weekend. It is about to hit the century mark in Germany ($93.24 million); Russia ($93.22 million); and the U.K. ($92.80 million). It could have enough left in the tank to do the same in a number of other markets, but it will be more challenging. For instance, in South Korea it added $5.43 million on 526 screens to take its running tally to $79.31 million while it had similar results in Japan ($5.75 million over the weekend and $77.73 million in total), Australia ($5.07 million on 420 screens for $76.76 million) and in Spain ($5.65 million on 579 screens for $73.88 million). It is too early to tell where it will end up in Italy, but it did add $12.38 million on 856 screens over the weekend for a total of $35.49 million after two. It could reach $100 million or more in ten markets. Calling it amazing seems redundant at this point.
More...
January 25th, 2010
The Directors Guild of America release their nominations over three days stretched out over a week. Only two of the nominations are for theatrical releases, but at least the documentary category had some interesting nominees. On the other hand, Feature Film merely enforces the trends we've seen throughout Awards Season.
More...
January 24th, 2010
Up in the Air started its international run in sixth place with $5.83 million on 936 screens in 9 markets. This includes a fifth place debut in the U.K. where it earned $2.13 million on 325 screens while it also managed fifth in Australia with $1.61 million on just 173 screens. While it is hard for films to open in limited release domestically and expand wide, it is usually a lot harder for these films to thrive internationally. After all, many international markets are simply too small to have a thriving limited release marketplace. It will be interesting to see if this film will be able to take its performance during Awards Season and turn it into a successful international run despite this.
More...
January 17th, 2010
Some might debate the predictive value of The Golden Globes.
After all, they don't have all of the same categories as the Oscars, and the results for Best Picture in particular have varied from the Oscar result many times over the years.
However, it is hard to argue with the free publicity a film gets from winning, and the big winner tonight was Avatar.
More...
January 12th, 2010
The WGA announced their nominations this week, which include eleven awards, three of which are for theatrical releases.
More...
January 6th, 2010
The Producers Guild of America announced their nominations this week, and while there are only three categories for theatrical releases, they tend to be quite accurate predictors for the Oscar nominations.
This is great news for Up, which picked up nominations in two of the three categories.
More...
January 5th, 2010
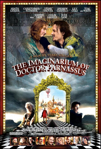
The Imaginarium of Doctor Parnassus topped the per theater chart this weekend, based on reports from theaters in the United States.
The film earned $128,000 in 4 theaters for an average of $31,909, which is roughly what it made last weekend.
It is also playing in many more theaters in Canada, but numbers have not been reported from those locations, at least so far this week.
The final figures may therefore, as last week, push the final average down considerably.
Second place went to to Lovely Bones, which climbed more than 54% to an average of $21,559 in three theaters.
This is excellent news for its planned expansion in a couple of weeks, assuming it doesn't fall by the same amount next week.
White Ribbon opened next with an average of $19,949, also in three theaters.
The overall number one film, Avatar, was just a fraction behind, earning an average of $19,789.
At this point, we've nearly run out of superlatives to describe the film's box office run and it is far from over.
Crazy Heart saw growth over the weekend, up 38% to an average of $18,416.
3 Idiots expanded somewhat and earned a very impressive average of $11,322 in 132 theaters.
A Single Man returned to the $10,000 club with an average of $10,586 in 46 theaters.
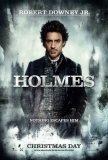
The final film in the $10,000 club was Sherlock Holmes, which fell sharply but still managed an average of $10,097.
More...
January 4th, 2010
2010 continued the record-breaking ways of 2009 thanks to incredible holds by most films in the top ten.
In fact, all but one film we talked about on Thursday topped expectations, sometimes by margins that are difficult to believe.
Overall ticket sales were $220 million, which is 21% lower than last weekend, but a stunning 44% higher than last year.
2009 ended the year with an estimated total of $10.60 billion, which was more than 10% higher than last year's final tally, and almost $1 billion more than the previous record.
Simply amazing.
More...
January 3rd, 2010
Avatar continued its record-setting pace over the weekend, easily breaking the record for the biggest third weekend for a movie (see chart) and also setting a new record for a weekend in January (see chart).
Fox estimates a $68.3 million weekend, down a little under 10% from Christmas weekend.
Total box office after 17 days is $352 million in the US, and an incredible $670.2 million internationally, for $1.022 billion worldwide, which will put it 4th in the all-time list of global earners by Monday (see chart).
Although it's too soon to tell where it will end up in the US (beyond stating the obvious that $400 million is a formality at this point, and $500 million looks all but certain), the movie will clearly end up either number one or two on the list of biggest global earners in theaters.
Titanic's all-time record looks under severe threat already.
More...
December 31st, 2009
As usual, there are no new wide releases the first weekend of the year, but that doesn't mean there are no stories to talk about.
The most obvious story is the comparison to last year, which was led by Marley & Me with just over $24 million.
It is very likely that wouldn't even come close to reaching the top three this weekend.
More...
December 29th, 2009
As it did on the overall chart, Avatar led the way on the per theater chart, earning an average of $21,880.
Second place went to the overall second place film, Sherlock Holmes, which pulled in an average of $18,031.
3 Idiots did something most Bollywood films don't manage to do, namely top $10,000 on the per theater chart.
Additionally, it was a wider release than most of its compadres, which makes this opening even more impressive.
Crazy Heart expanded somewhat, but still remained strong with an average of $13,321 and this makes hitting milestones much more likely.
Alvin and the Chipmunks: The Squeakquel was the third wide release to crack $10,000 with an average of $13,210.
Finally we get to Lovely Bones, which is down to an estimated average of $12,667.
This is roughly a third of its opening weekend average and it still hasn't expanded, which doesn't bode well.
More...
December 28th, 2009
The final weekend of 2009 turned into a record-breaker with two massive new releases and a holdover that still managed to come out on top.
Overall the box office pulled in an estimated $278 million over the weekend, which crushed the previous record for the biggest weekend by all movies combined.
Additionally, this was 39% higher than the same weekend last year and pushed 2009's running tally to $10.38 billion.
This is 9.2% higher than last year's pace and more than 7% more than the previous record, and there is another week left to go.
More...
December 23rd, 2009
It's Christmas on Friday, but one new release got the jump on the competition on Wednesday night. With three wide releases and two movies expanding wide, or at least wide-ish, this weekend will be just as busy as it was last year.
However, despite all of these new films, it looks like we could have a repeat on top as Avatar continues its strong run.
Meanwhile, the 2009 box office running tally surpassed the $10 billion mark early on Tuesday.
This is of course the first time the yearly box office total has hit eleven digits and there are more records remaining to be broken.
More...
December 22nd, 2009
Like last week, the number one film on the per theater chart managed that feat despite mixed reviews.
This week it was Nine, which opened with an average of $64,308, but I am concerned about its ability to expand, especially if its word-of-mouth match its reviews.
The number one film on the overall chart, Avatar, placed second with $22,313 while Crazy Heart was not that far behind with an average of $20,666.
Up in the Air's expansion continues but it remained strong on the per theater chart with an average of $18,344 in 175 theaters.
Finally, Lovely Bones saw its average plummet this weekend to $15,032, which is more than 60% lower than last weekend.
Had this been accompanied by an expansion this wouldn't be an issue, but it is still playing in just three theaters.
More...
December 22nd, 2009
It was a fantastic weekend at the box office as the top film topped expectations and broke records, admittedly by narrow margins, but records nonetheless.
Overall the box office pulled in $138 million, which was 42% higher than last weekend and an outstanding 56% higher than the same weekend last year.
Year-to-date, 2009 has earned $9.96 billion, extending its record and moving closer to the $10 billion milestone.
This time last year the cumulative box office was $9.15 billion, meaning 2009 has an 8.8% lead.
More...
December 17th, 2009
The SAG nominations were announced this week, and the trend of the year continues with Up in the Air leading the way, but no one film dominating. This time around Up in the Air was in a three-way tie with Inglourious Basterds and Precious, which makes the race even more interesting.
More...
December 16th, 2009
The Hollywood Foreign Press Association announced their nominations this week, but looking over the list of films chosen, it is hard to declare any one film as the big winner. Up in the Air did pick up six Golden Globe nominations, including several of the most prestigious nominations, but it is far from the only major player.
More...
December 15th, 2009
Lovely Bones defied critics to open on top of the per theater chart with $38,872 in three theaters.
Up in the Air remained in second place with an average of $33,255 in 72 theaters, while it nearly reached the top ten on the overall chart.
A Single Man opened with more than $200,000 in 9 theaters for an average of $24,148.
Broken Embraces spent its fourth weekend in the $10,000 club with an average of $18,255 in six theaters.
It is starting to expand, so it should start hitting major milestones soon.
More...
December 13th, 2009
Disney claimed top spot at the box office this weekend as The Princess and the Frog expanded nationwide.
But with a weekend box office estimated at $25 million, the movie will need to have great legs over the holidays if Disney's going to recoup its investment.
The movie has good reviews and is ideal family fare, so its chances are good, but the studio is looking at the same nail biting exercise as they're going through with A Christmas Carol, which opened with $30 million and reached an estimated $124 million this weekend.
More...
December 9th, 2009
Fewer films reached the $10,000 mark on the per theater chart this weekend than last weekend.
The Princess and the Frog, saw its per theater average drop a minuscule 5% to $373,855, which likely represents nearly universal sellouts throughout the weekend in both theaters.
Second place went to Up in the Air with an average of $78,763 in 15 theaters.
That is an impressive start and with the film already proving itself to be an Awards Season player, its future is indeed bright.
Broken Embraces continues to perform in limited release and earned an average of $44,285 in two theaters, but it better expand fast before momentum is lost.
Mystery Team was a surprise entry in the $10,000 club earning a reported $11,259 in one theater.
More...
December 6th, 2009
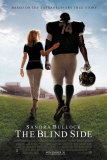
The Blind Side rode tremendous word of mouth to a 3rd weekend victory at the box office, according to studio estimates released on Sunday.
Although the movie fell nearly 50% from its Thanksgiving performance, that was better than any other movie in the top ten, and gave the drama a safe $5 million lead over second place New Moon.
Blind Side is estimated at $20.44 million for the weekend, New Moon will come in around $15.7 million.
More...
December 4th, 2009
Just the two limited releases on this week's list, but one of them, Up in the Air, could be a major player during this year's Awards Season. It has already picked up a prestigious award this week.
More...
December 1st, 2009
November turned out to be a good month with more films meeting or exceeding expectations that missing.
We also saw records broken as 2009 marches closer to the all-time record, and the possibility of becoming the first year to hit $10 billion in total ticket sales growing.
It won't need that much to get there, and even if just one or two of the predicted $100 million hits this month get to that milestone, we will still finish the year by breaking records.
More...