November 29th, 2010
This is the first Tuesday after Thanksgiving, which means it is the day after Cyber Monday and the end of the busiest gift buying weekend of the year. So it should come as no surprise that there's a bit of a lull when it comes to DVD / Blu-ray releases. In fact, the biggest selling film of the week doesn't come out till Saturday. There are still more than a few releases that are worth checking out, including this week's Pick of the Week, Fantasia / Fantasia 2000 on Blu-ray / DVD Combo Pack. However, there is no real depth to this week's list and the drop from top tier to second tier is fast and steep.
More...
November 24th, 2010
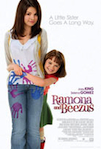
Ramona and Beezus is based on a series of novels that have been entertaining kids for more than half a century. As a G-rated kids flick, and not an animated one, it didn't have huge expectations placed upon it. But given its reviews, I was still expecting more at the box office. Will it find a bigger audience on the home market? And will it be worth picking up, or just renting?
More...
November 23rd, 2010
Toy Story 3 remained on top of the sales chart this week with 934,000 units / $16.53 million for the week and 4.79 million units and $89.63 million after two. It is now the fourth-best-selling DVD of 2010 in terms of units and dollars, while it could climb another spot by the time Black Friday is over.
More...
November 8th, 2010
It's a week of box office disappointments on the home market with Charlie St. Cloud, Ramona and Beezus, and Scott Pilgrim vs. The World coming out. (There is one box office hit coming out this week, but given its reviews, the less said the better.) However, while none of them really found audiences during their theatrical releases, two of the three earned excellent reviews, and Scott Pilgrim's Two-Disc Blu-ray/DVD Combo Pack is worthy of the Pick of the Week honors.
More...
August 2nd, 2010
It was a mixed bag this weekend with no film taking the box office by surprise. However, no film truly bombed either, so at least there is good news there. The overall box office was $145 million over the weekend, down 11% from last weekend, but more importantly up 15% from the same weekend last year. Year-to-date, 2010 has now earned $6.72 billion compared to 2009's running tally of $6.42 billion. Ticket sales are still lagging behind last year's pace, but by less than 1%.
More...
July 26th, 2010
While neither of the two new releases exactly earned blockbuster level openings, Inception made up for this by topping nearly everyone's high end expectations. This helped the overall box office reach still summer-like proportions at $162 million. Granted, this was down 9% from last weekend, but more importantly, it's up 7% from last year.
Year-to-date, 2010 has earned $6.49 billion compared to $6.21 billion for 2009, while ticket sales are still down 2%.
More...
July 25th, 2010
An impressive second weekend hold by Inception will give it a relatively comfortable win this weekend, according to studio estimates released on Sunday.
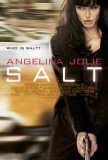
With a decline of just 31%, Christopher Nolan's sci-fi thriller will end up with around $43.5 million, according to Warner Bros., $7 million ahead of Salt, which is set to open with about $36.5 million.
Both movies topped a per theater average of $10,000, and Sony won't be too disappointed with second place.
More...
July 22nd, 2010
Every year as the end of the summer school holidays near, the summer blockbuster season simply ends.
Usually this takes place early in August, but some years we get an extra week or two of $100 million releases.
This year, it could end this weekend.
Neither of the two wide releases are surefire hits; in fact, combined they might not make $100 million during their theatrical runs.
Worse still, there's a chance we might not get another $100 million hit until November.
(This prediction is a little bleak, but certainly not out of the question.)
Weakness in the new releases could leave Inception in first place during its sophomore stint, while if it holds as well as some think, it could help 2010 maintain pace with last year.
More...
July 1st, 2010
The summer has really started to get depressing, not just disappointing. It's getting to the point where a film merely matching expectations is enough to celebrate, while beating expectations is practically unheard of. Speaking of which, of the ten wide releases that opened in June only four matched expectations. Granted, that's better than May, but still disappointing. Going forwards, what is likely the biggest hit of July actually opens on the last day of June. Given how front-loaded The Twilight Saga: Eclipse could be, this could have a serious effect when we compare this year's box office to last July.
More...