February 11th, 2014
It's a strange week on the home market. If you look at the top ten selling new releases on Amazon.com, there are a couple of first run releases, a catalog title, TV on DVD release, and some limited releases. That's basically every category there is. The biggest release is Ender's Game, a film that failed to find an audience in theaters. It barely earned overall positive reviews and it isn't a contender for Pick of the Week. Some of the other best-selling releases are contenders, like The Jungle Book: Blu-ray Diamond Edition or Sherlock: Season Three on DVD or Blu-ray. There are also a few of the smaller releases that were in consideration, including Doctor Who: Story 33: The Moonbase and G.B.F. on DVD. But in the end, I went with Wadjda on Blu-ray Combo Pack for Pick of the Week. One last note, Dry Spell is coming out on Video on Demand. It's a good chance to support ultra-low-budget filmmaking and the reviews I've read have been positive.
More...
January 16th, 2014
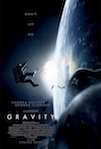
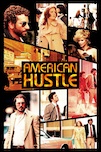
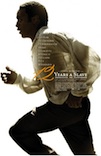
The Oscar nominations were announced this morning and there are some surprises mixed in with the predictable results. Gravity and American Hustle led the way with ten nominations each while 12 Years a Slave was right behind with nine. The fact that 12 Years a Slave wasn't the leader is the first of the surprises.
More...
January 13th, 2014
Hollywood Foreign Press Association handed out the Golden Globe awards last night, and there were a few surprises in the mix. American Hustle led the way with three wins, which isn't a real surprise, but I think many thought another film would lead with three or more wins. The only other film to earn more than one award was Dallas Buyers Club at just two. That might give you a hint at what the big surprise was.
More...
December 14th, 2013
Hollywood Foreign Press Association announced their Golden Globe nominations this week, and a clear picture is forming. 12 Years a Slave was again the recipient of the most nominations, but this time it was a tie, as it and American Hustle both grabbed seven nominations. If you look down the list of other multi-nominated films, you will find a number of familiar faces.
More...
December 14th, 2013
SAG handed out nominations over the week, and like with the Independent Spirit Awards, 12 Years a Slave led the way and earned four nominations. It wasn't the only film that was singled out.
More...
December 4th, 2013
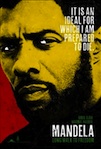
Mandela Long Walk to Freedom earned first place on the per theater chart with an average of $21,071 in four theaters. However, its reviews are only good, not great, and it likely won't have great legs. Frozen and The Hunger Games: Catching Fire were neck and neck with averages of $18,009 and $17,819 respectively.
More...
November 28th, 2013
Independent Spirit Award started the Awards Season this week, handing out its nominations. 12 Years a Slave led the way with seven nominations, but it wasn't the only film to pick up multiple nominations.
More...
November 20th, 2013
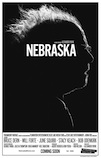
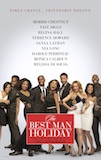
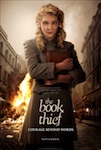
Nebraska led the way on the per theater average with an average of $35,100 in four theaters. This is not as strong as Alexander Payne's previous release, especially if you take into account the difference in the theater count between the two films. The Great Beauty was next with $23,442 in its lone theater. The Best Man Holiday was the only wide release to crack the $10,000 club earning an average of $14,875 during its opening weekend. The Book Thief and The Christmas Candle were right behind with averages of $14,501 and $14,140 respectively.
More...
November 17th, 2013
Although it's still the calm before the storm that will be Catching Fire next weekend, this weekend has a healthy look to it thanks to a stronger-than-expected debut for The Best Man Holiday, which will post about $30.5 million according to Universal's Sunday projection, more than three times the debut figure for the previous film in the franchise. That won't be enough to unseat Thor at the top of the chart though. The Marvel superhero will post about $38 million, down a reasonable 55% from its opening frame. Most other returning films are enjoying good holds too.
More...
November 12th, 2013
The Book Thief was a surprise top spot with an average of $26,251 in four theaters. It was seen by some as a possible Awards Season contender, but its reviews suggest otherwise. Thor: The Dark World was first on the overall box office and second on the per theater chart with $22,322. Dallas Buyers Club fell from first to third on the per theater chart, but with a still strong average of $18,249 in 35 theaters.
More...
November 10th, 2013
Thor: The Dark World gets the holiday season off to a start this weekend with a powerful display at the box office. Disney is pegging its opening weekend at $86.8 million, which will be a healthy 30% boost from the debut of the first film in the franchise and also one of the ten biggest weekends in November. It's the first film in the Avengers über-franchise to open outside of the May-July Summer season, but that certainly doesn't seemed to have harmed it at the box office, and it won't have much competition until Catching Fire opens in a couple of weeks' time. All said, it looks a virtual certainty to top the box office performance of the original.
More...
November 7th, 2013
Dallas Buyers Club took top spot on the per theater chart with an average of $28,985 in nine theaters. Add in its reviews and this is a great start. 12 Years a Slave was finally pushed out of top spot, but it still has a very strong showing with an average of $11,688 in more than 400 theaters.
More...
October 22nd, 2013
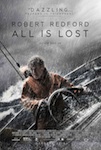
12 Years a Slave opened with a stellar average of $48,617 in 19 theaters. With a planned expansion, this is a great start. All is Lost was well back with an average of $15,597 in six theaters. This isn't a bad start and its reviews suggest long legs, but it might get overshadowed by 12 Years a Slave. The final film in the $10,000 club was Kill Your Darlings, which was right behind with an average of $14,750 in four theaters.
More...
October 20th, 2013
Gravity will become the first film in 2013 to win three straight three-day weekends, according to studio estimates released on Sunday. With $31 million expected, the film is down just 28% from last weekend and has reached a formidable $170.5 million. That puts in in the top 10 for the year, with plenty more to come. Fellow Oscar-hopefuls 12 Years a Slave, All is Lost and Kill Your Darlins are the other films making waves this weekend (literally in one case).
More...
October 18th, 2013
It is not a busy week when it comes to limited releases on this week's list, but at least we have a couple that are earning stellar reviews and could expand wide. All is Lost has the reviews to become a big hit and an Awards Season player, but it doesn't have the buzz. 12 Years a Slave has the buzz, as well as the reviews. While opening in limited release is always a risky maneuver, 12 Years a Slave has a better shot at opening in the top ten than it does of bombing outright.
More...