March 2nd, 2016
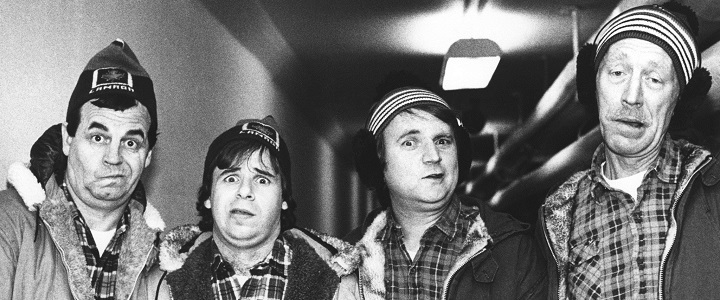
There are some really good releases on this week's Home Market Release Report, including many that either won or were competing for Oscars, like Creed, Room, etc. However, once you get past the cream of the crop, there isn't much in the way of depth. Most of the Oscar contenders are Pick of the Week Contenders, but the best release by far is The Adventures of Bob & Doug McKenzie: Strange Brew on Blu-ray. This is the greatest movie ever made.
More...
February 28th, 2016
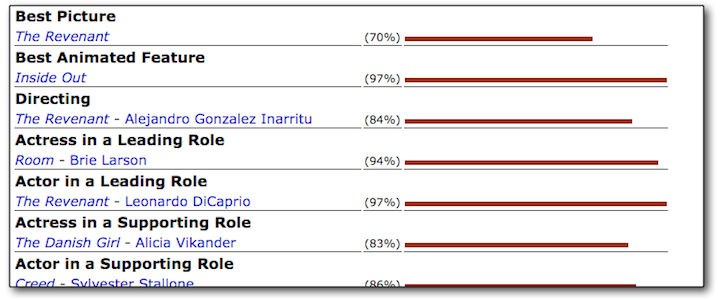
Voting in our annual Predict the Academy Awards contest is now closed, and we can reveal the final vote totals in each category, along with the rough probability for which film will win each award. This is a year where readers are very confident about the outcomes in many of the categories. In fact, there isn’t a single major category where less than 50% of readers picked the same winner, and there are five Oscars where 90% or more of readers agreed on the outcome, including a massive 97% of the vote for Inside Out for Best Animated Feature. That makes The Revenant a rather more uncertain bet, with 70% of readers favoring it for Best Picture. That’s actually theoretically the closest call among all the major prizes…
More...
February 28th, 2016
-4-News.jpg)
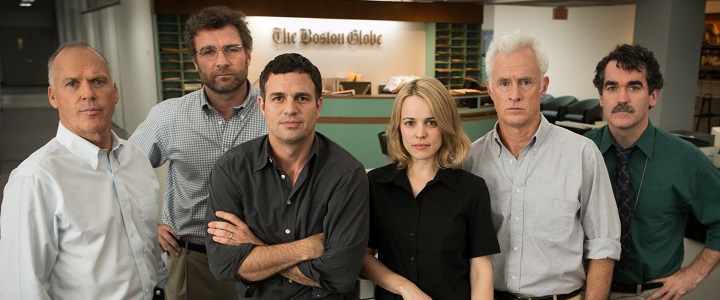
It’s Oscar day and, if all goes to plan, I will be live-blogging the ceremony tonight. Here is the list of nominees marked according to predictions from our readers, and my personal wishes. Nominees in Bold are the ones predicted to win by our readers (we’ll have a full rundown of the predictions at noon, after the contest ends). If I am predicting a different film, those are in Italics. Meanwhile, the nominees I want to win, but don’t think will win, are Underlined. There are a few categories where the film I really think deserves the award was not even nominated, plus a few I don’t have a real opinion on.
If you haven’t done so already, it’s not too late to enter our Oscar competition, and win all Best Picture nominees on Blu-ray or DVD.
More...
February 27th, 2016
-3-News.jpg)
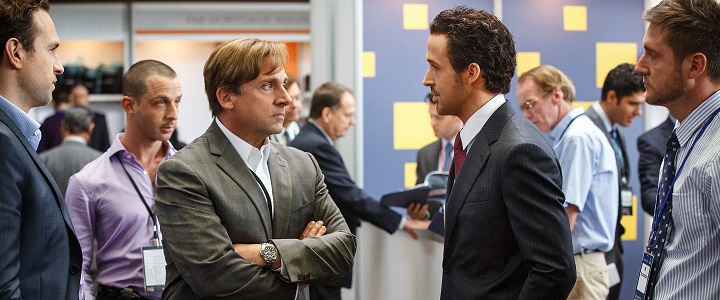
With our annual Oscar Prediction contest closing at noon tomorrow, now is the best time to look at the nominees and try to figure out who the favorites are and which films should just feel honored to be nominated. This morning, we get to the final category, Best Picture. The film I think should win, Inside Out, wasn't even nominated. Of the movies on this list, I think The Martian is the best. If you look at the odds makers, it isn’t even in the top three. I’m going to be doubly disappointed tomorrow.
More...
February 26th, 2016
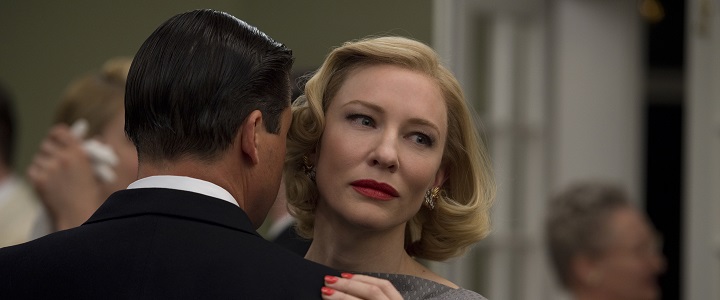
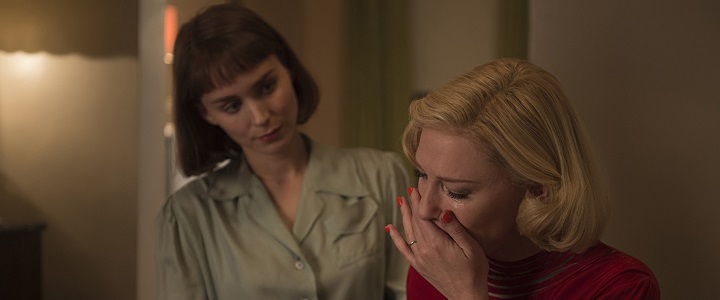
-1-News.jpg)
With our annual Oscar Prediction contest underway, now is the best time to look at the nominees and try and figure out who the favorites are and which films should just feel honored to be nominated. The Best Lead Actress is not generating a lot of buzz, but one actress has been constantly winning and is the overwhelming favorite.
More...
February 20th, 2016
With our annual Oscar Prediction contest underway, now is the best time to look at the nominees and try and figure out who the favorites are and which films should just feel honored to be nominated. The Best Adapted Screenplay category is about as competitive as the Best Original Screenplay, which is to say it isn't competitive at all.
More...
February 15th, 2016
-2-News.jpg)
The BAFTA awards were handed out over the weekend. There were two main winners, The Revenant, which won most of its five awards in the high-prestige categories, and Mad Max: Fury Road, which earn all four of its awards in technical categories. It appears the Oscars will be very similar in that breakdown.
More...
January 31st, 2016
The Screen Actors Guild winners were handed out last night and for the most part the winners here will likely walk away with an Oscar. There is one major exception.
More...
January 15th, 2016
-1-News.jpg)
The Oscar nominations were announced at 5:30 am Pacific time. Nothing is good that early in the morning. Worse still, this was a terrible year for snubs, especially when it comes to diversity of the nominees. The voters for the Oscars are 94% white and 77% male... but that's still more diverse than the list of nominees. The Revenant led the way with 12 nominations and it is expected to win a few of those, while it is a serious contender in most of the categories it was nominated in.
More...
January 13th, 2016

There were only three films in the $10,000 club this weekend and all of them were holdovers. Leading the way was Anomalisa with an average of $12,738 in 17 theaters. At this pace, the film will earn some measure of mainstream success. However, unless it wins an Oscar, it likely won't match its $8 million production budget in theaters. The Revenant slipped into second place with $11,801, while the overall number one film, Star Wars: The Force Awakens, was next with $10,245.
More...
January 11th, 2016
The Golden Globes were handed out on Sunday evening. There were a few minor surprises and some infuriating results. On the other hand, no one film truly dominated, with The Revenant leading the way with just three wins. Only two other movies earned more than one win, The Martian and Steve Jobs.
More...
January 9th, 2016

The BAFTA nominations were announced and you can read them on their site... in alphabetical order. Alphabetical order is very useful in most circumstances, but not here. On the other hand, the nominees within each category are not presented in alphabetical order. ... Are the BAFTAs trolling us? As for the actual nominees, the big winners here are Bridge of Spies and Carol, both of which earned nine nominations. For Carol, this is just another impressive score, but this was a pleasant surprise for Bridge of Spies.
More...
December 15th, 2015
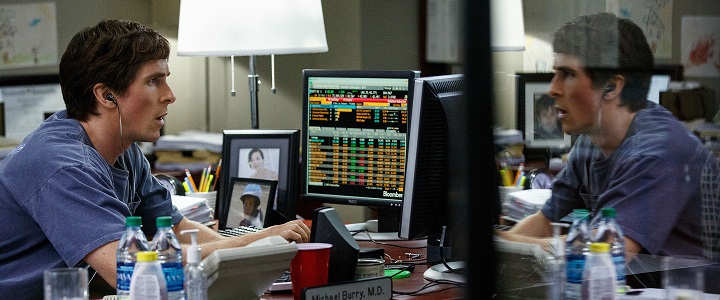
We have a new champion on top of the per theater chart this week, as The Big Short earned one of the best limited release openings of the year. Its average of $88,191 was behind only Steve Jobs for the year and Steve Jobs opened in half as many theaters as The Big Short, 8 to 4. Carol remained strong in second place with an average of $21,105 in 16 theaters. Thankfully it is expanding, but I'm worried the studio waited too long and it won't reach its potential. Yellow Day opened with an average of $13,130 in two theaters. The Danish Girl rounded out the $10,000 club with an average of $10,964 in 24 theaters. By this time next week, it could be over $1 million in total.
More...
December 10th, 2015
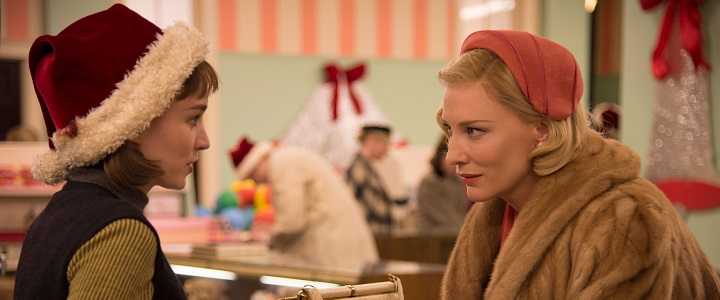
The Golden Globes nominations were announced this morning and we are already beginning to see a trend for this year's Awards Season. For the most part, the same films are coming up over and over again. Carol led the way with five awards, while there was a three-way tie for second place with The Big Short, The Revenant and Steve Jobs each picking up four.
More...
December 9th, 2015
-1-News.jpg)
The Screen Actors Guild nominations were announced today and there are at least a few surprises to talk about. Trumbo led the way with three nominations, but there were six films with two nods apiece. Six!
More...
December 1st, 2015
Carol remained in first place on the per theater chart with an average of $49,443 in four theaters. This is 22% lower than the film's opening weekend average, which isn't bad for a limited release. The Danish Girl opened in a close second place with $46,830, also in four theaters. The Hunger Games: Mockingjay - Part 2 earned first place on the overall chart and third place on the per theater chart with an average of $12,456. Janis: Little Girl Blue earned an average of $10,931 in two theaters, which is great for a documentary. The second wide release in the $10,000 club was The Good Dinosaur with an average of $10,444.
More...
November 25th, 2015
Awards Season begins with the Independent Spirit Awards nominations. There were definitely some surprise nominees this year, but that also meant there were some unfortunate snubs as well. The overall leader was Carol, which just opened this past weekend. This is great timing and should help its box office numbers, as well as its chances throughout Awards Season. Its six nominations were one ahead of Beasts of No Nation and Spotlight. (One of Spotlight's was the Robert Altman Award, which has no nominations, just one winner.)
More...
November 17th, 2015
There was only one new release in the $10,000 club and it had to settle for third place on the per theater chart. This left Spotlight in first place with an average of $22,561 in 60 theaters. This is a great result for a film expanding from five to 60 theaters. Brooklyn also expanded, going from five theaters to 23 theaters, while its per theater average remained strong with an average of $20,868. James White was the only new release in the $10,000 club debuting with $12,007 in its lone theater.
More...
November 10th, 2015
It was a busy week on the per theater chart with seven films in the $10,000 club. Spotlight led the way with an average of $59,002 in five theaters. This is the fourth best opening weekend average of 2015, just ahead of While We're Young and just behind Ex Machina. Brooklyn was next with an average of $37,456, also in five theaters. It opened on Wednesday, so its weekend average was a little lower than it otherwise would have been. The overall number one film, Spectre, was third with an average of $17,919. In Jackson Heights was on the opposite end of the scale playing in just one theater. It did well with an opening of $15,150. Trumbo was very close behind with an average of $14,835 in five theaters. Its reviews suggest it won't expand significantly, but this is a great start. The second wide release of the week was The Peanuts Movie, which opened with an average of $11,345. The final film in the $10,000 club was Peggy Guggenheim - Art Addict, which earned an average of $11,129 in two theaters.
More...
October 27th, 2015
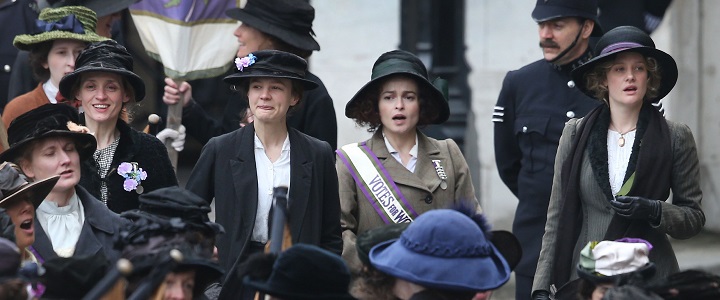
Suffragette started its potential Oscar-run earning first place on the per theater chart with an average of $19,056 in four theaters. That suggests room to grow, but perhaps not enough to expand truly wide. It will need to last in theaters long enough for Awards Season nominations to be announced and if it can do well then, it will boost its box office chances. Heart of a Dog was next with an opening of $13,893 in one theater. Room was the only holdover in the $10,000 club earning an average of $10,856 in 23 theaters. It will earn some measure of mainstream success, but unless Brie Larson earns some major Awards Season nominations, it won't expand truly wide.
More...
October 25th, 2015

Dismal is about the politest word that can be applied to the box office performance of new releases this weekend. None of the five films new in wide release managed to make the top three on the chart, and two of them didn’t even crack the top ten. That leaves The Martian and Goosebumps to battle it out for first place, and a fourth-week decline of just 25% for The Martian looks virtually certain to give it the win. Fox projects it will make $15.9 million for a total by the end of the weekend of $166 million or so. Its performance to date falls neatly between that of Interstellar and Gravity, which puts the sci-fi adventure on course for a final domestic box office of $230 million (see full comps here).
More...
October 21st, 2015
-2-News.jpg)
Room was in a close race for top spot on the per theater with last week's winner, but it came out on top with an average of $29,575 in four theaters. Steve Jobs was right behind with an average of $25,212 in 60. This film is going to expand wide this weekend and could lead the weekend. The Assassin earned an average of $11,973 in four theaters, which is strong for a foreign-language film. Meanwhile, Truth was right behind with an average of $11,039 in six.
More...
October 18th, 2015

A slightly-softer-than-expected (but still good) opening for Goosebumps will be enough to take the film to the top of the box office chart this weekend, according to studio projections released on Sunday morning. Sony expects the family horror adventure to come in with $23.5 million on opening weekend, which is a solid enough start, and sets the film up for a good run, helped by strong reviews and Halloween coming up in a couple of weeks. The Martian will land in second with a projected $21.5 million as of this morning, a slightly steeper-than-expected 42% decline from last weekend, and a total to date around $144 million. In general, we’re looking at quite a few steep drops from last weekend thanks to an unfavorable comparison with the Columbus Day long weekend and a batch of new releases.
More...
October 16th, 2015
It is a fantastic week for limited releases with a number of movies in various genres that are earning impressive reviews / loud buzz. There's documentaries (All Things Must Pass and A Ballerina's Tale); horror (Tales of Halloween); action (The Assassin); and even a potential Oscar winner (Room).
More...
-Thumbnail.jpg)