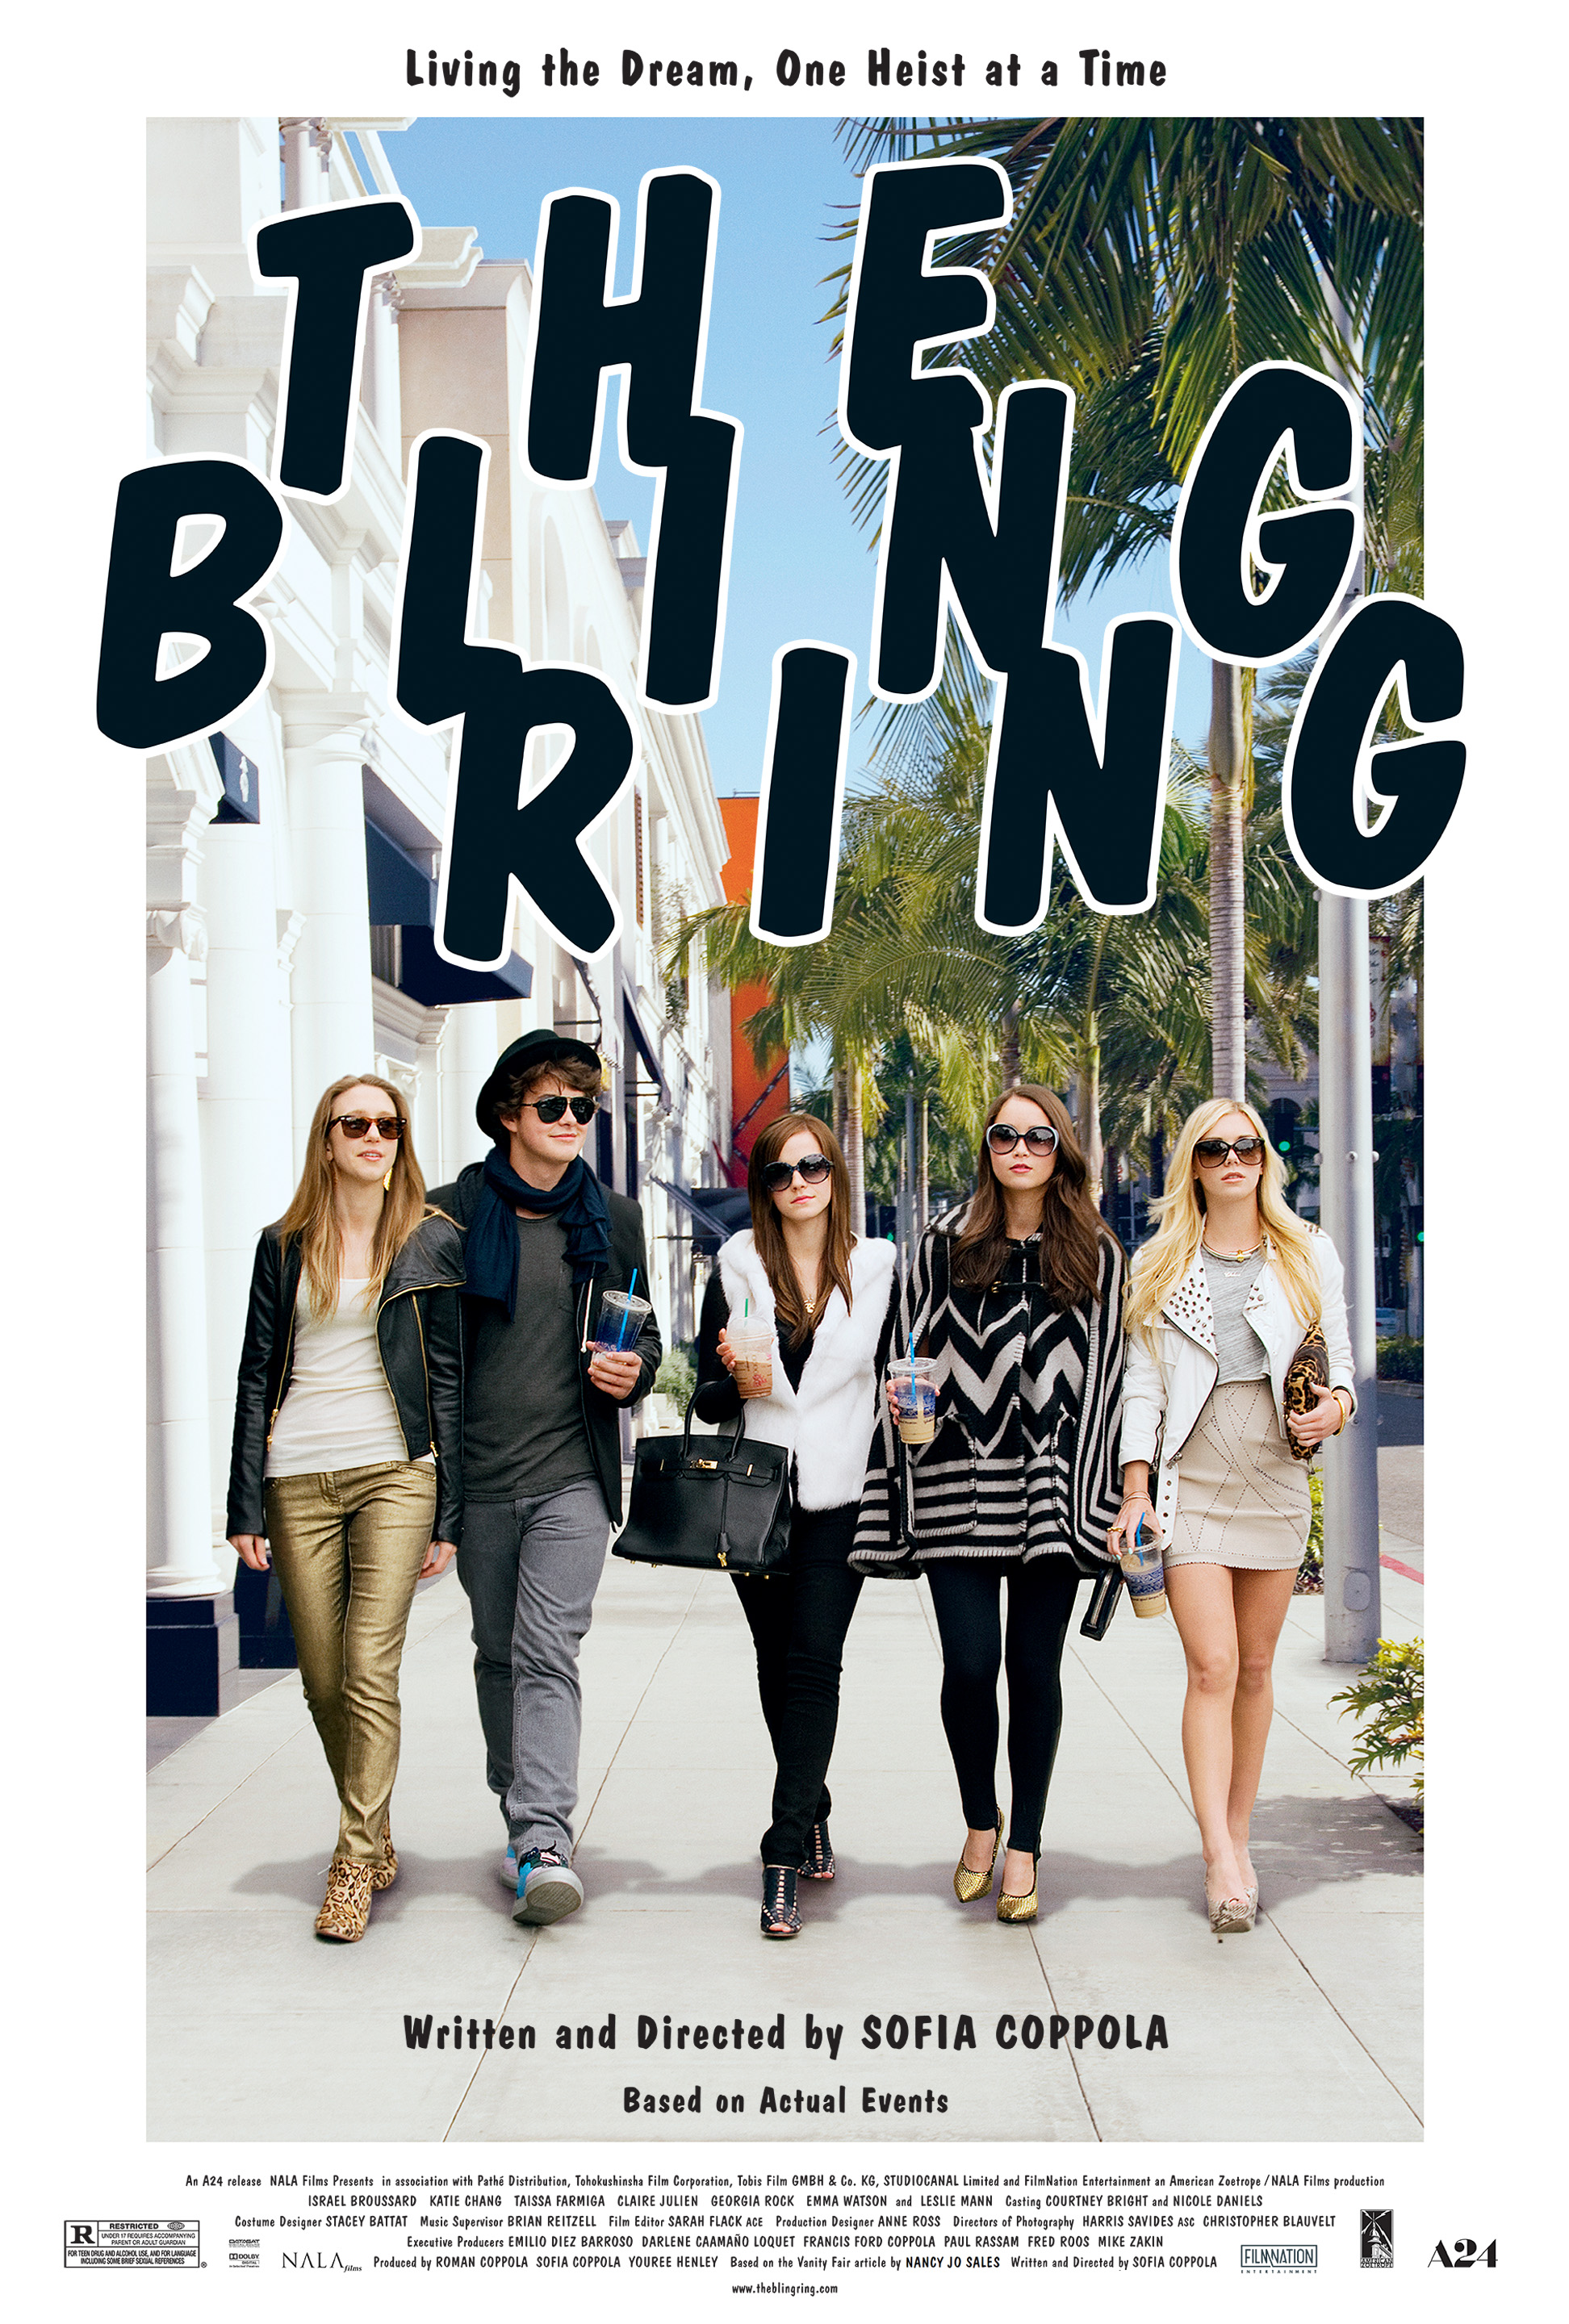
The Bling Ring (2013)
| Theatrical Performance | ||
| Domestic Box Office | $5,845,732 | Details |
| International Box Office | $6,561,759 | Details |
| Worldwide Box Office | $12,407,491 | |
| Domestic Physical Disc Sales | ||
| DVD Sales (estimated) | $1,172,673 | |
| Blu-ray Sales (estimated) | $324,410 | |
| Total | $1,497,083 | |
| OpusData ID: 188390100 More info... | ||
| Further financial details... | ||
Synopsis
In the fame-obsessed world of Los Angeles, a group of teenagers take us on a thrilling and disturbing crime-spree in the Hollywood hills. Based on true events, the group, who were fixated on the glamorous life, tracked their celebrity targets online, and stole more than 3 million in luxury goods from their homes. Their victims included Paris Hilton, Orlando Bloom, and Rachel Bilson, and the gang became known in the media as “The Bling Ring.
Metrics
| Opening Weekend: | $214,395 (3.7% of total gross) |
| Legs: | 2.92 (domestic box office/biggest weekend) |
| Domestic Share: | 47.1% (domestic box office/worldwide) |
| Theater counts: | 5 opening theaters/650 max. theaters, 2.6 weeks average run per theater |
| Infl. Adj. Dom. BO | $8,599,623 |
Movie Details
| Domestic Releases: | June 14th, 2013 (Limited) by A24 |
| International Releases: | August 8th, 2013 (Wide) (Australia)
October 24th, 2013 (Wide) (Argentina) December 26th, 2023 (Limited) (Australia) |
| Video Release: | September 17th, 2013 by Lionsgate Home Entertainment |
| MPA Rating: | R for teen drug and alcohol use, and for language including some brief sexual references. (Rating bulletin 2263, 3/20/2013) |
| Running Time: | 90 minutes |
| Cast, crew, or production detail: | Breaking the Fourth Wall |
| Plot point: | Celebrity Worship, Internet, Juvenile Delinquent |
| Source material: | Inspired by a True Story |
| Subgenre: | Crime Drama |
| Source: | Based on Factual Book/Article |
| Genre: | Drama |
| Production Method: | Live Action |
| Creative Type: | Dramatization |
| Production/Financing Companies: | Nala Films, American Zoetrope, Pathe Distribution, Tohokushinsha Film Corporation, Tobis Film GMBH & Co., KG, StudioCanal, FilmNation Entertainment |
| Production Countries: | United States |
| Languages: | English |
Weekend Box Office Performance
| Date | Rank | Gross | % Change | Theaters | Per Theater | Total Gross | Week |
|---|---|---|---|---|---|---|---|
| Jun 14, 2013 | 21 | $214,395 | 5 | $42,879 | $214,395 | 1 | |
| Jun 21, 2013 | 11 | $2,001,903 | +834% | 650 | $3,080 | $2,343,144 | 2 |
| Jun 28, 2013 | 13 | $837,045 | -58% | 630 | $1,329 | $4,350,350 | 3 |
| Jul 5, 2013 | 22 | $322,407 | -61% | 159 | $2,028 | $4,962,991 | 4 |
| Jul 12, 2013 | 28 | $157,907 | -51% | 97 | $1,628 | $5,458,152 | 5 |
| Jul 19, 2013 | 42 | $70,021 | -56% | 38 | $1,843 | $5,628,611 | 6 |
| Jul 26, 2013 | 44 | $49,872 | -29% | 34 | $1,467 | $5,726,506 | 7 |
| Aug 9, 2013 | 62 | $16,981 | 40 | $425 | $5,806,460 | 9 | |
| Aug 16, 2013 | 79 | $5,784 | -66% | 18 | $321 | $5,824,524 | 10 |
| Aug 23, 2013 | 84 | $2,519 | -56% | 11 | $229 | $5,831,565 | 11 |
| Sep 6, 2013 | 98 | $2,724 | 6 | $454 | $5,841,046 | 13 |
Daily Box Office Performance
| Date | Rank | Gross | %YD | %LW | Theaters | Per Theater | Total Gross | Days |
|---|---|---|---|---|---|---|---|---|
| Jun 14, 2013 | - | $77,947 | 5 | $15,589 | $77,947 | 1 | ||
| Jun 15, 2013 | - | $69,997 | -10% | 5 | $13,999 | $147,944 | 2 | |
| Jun 16, 2013 | - | $65,043 | -7% | 5 | $13,009 | $212,537 | 3 | |
| Jun 17, 2013 | - | $37,016 | -43% | 5 | $7,403 | $251,411 | 4 | |
| Jun 18, 2013 | - | $34,324 | -7% | 5 | $6,865 | $285,735 | 5 | |
| Jun 19, 2013 | - | $32,164 | -6% | 5 | $6,433 | $317,899 | 6 | |
| Jun 20, 2013 | - | $23,342 | -27% | 5 | $4,668 | $341,241 | 7 | |
| Jun 21, 2013 | 11 | $742,792 | +3,082% | +853% | 650 | $1,143 | $1,084,033 | 8 |
| Jun 22, 2013 | 12 | $671,003 | -10% | +859% | 650 | $1,032 | $1,755,036 | 9 |
| Jun 23, 2013 | 10 | $588,108 | -12% | +804% | 650 | $905 | $2,343,144 | 10 |
| Jun 24, 2013 | 10 | $304,164 | -48% | +722% | 650 | $468 | $2,647,308 | 11 |
| Jun 25, 2013 | 10 | $341,396 | +12% | +895% | 650 | $525 | $2,988,704 | 12 |
| Jun 26, 2013 | 11 | $281,070 | -18% | +774% | 650 | $432 | $3,269,774 | 13 |
| Jun 27, 2013 | 11 | $243,531 | -13% | +943% | 650 | $375 | $3,513,305 | 14 |
| Jun 28, 2013 | 14 | $258,008 | +6% | -65% | 630 | $410 | $3,771,313 | 15 |
| Jun 29, 2013 | 14 | $311,352 | +21% | -54% | 630 | $494 | $4,082,665 | 16 |
| Jun 30, 2013 | 13 | $267,685 | -14% | -54% | 630 | $425 | $4,350,350 | 17 |
| Jul 1, 2013 | 14 | $155,217 | -42% | -49% | 630 | $246 | $4,505,567 | 18 |
| Jul 2, 2013 | 12 | $135,017 | -13% | -60% | 630 | $214 | $4,640,584 | 19 |
| Jul 5, 2013 | - | $109,684 | -57% | 159 | $690 | $4,750,268 | 22 | |
| Jul 6, 2013 | - | $114,345 | +4% | -63% | 159 | $719 | $4,864,613 | 23 |
| Jul 7, 2013 | - | $98,378 | -14% | -63% | 159 | $619 | $4,962,991 | 24 |
| Jul 8, 2013 | - | $44,632 | -55% | -71% | 159 | $281 | $5,007,623 | 25 |
| Jul 12, 2013 | - | $46,200 | -58% | 97 | $476 | $5,053,823 | 29 | |
| Jul 13, 2013 | - | $63,308 | +37% | -45% | 97 | $653 | $5,117,131 | 30 |
| Jul 14, 2013 | - | $48,399 | -24% | -51% | 97 | $499 | $5,458,152 | 31 |
| Jul 15, 2013 | - | $23,432 | -52% | -47% | 97 | $242 | $5,481,584 | 32 |
| Jul 16, 2013 | - | $27,832 | +19% | 97 | $287 | $5,509,415 | 33 | |
| Jul 17, 2013 | - | $25,675 | -8% | 97 | $265 | $5,535,090 | 34 | |
| Jul 18, 2013 | - | $23,501 | -8% | 97 | $242 | $5,558,591 | 35 | |
| Jul 19, 2013 | - | $21,006 | -11% | -55% | 38 | $553 | $5,579,597 | 36 |
| Jul 20, 2013 | - | $27,773 | +32% | -56% | 38 | $731 | $5,607,370 | 37 |
| Jul 21, 2013 | - | $21,242 | -24% | -56% | 38 | $559 | $5,628,611 | 38 |
| Jul 22, 2013 | - | $10,847 | -49% | -54% | 38 | $285 | $5,639,459 | 39 |
| Jul 24, 2013 | - | $12,469 | -51% | 38 | $328 | $5,664,587 | 41 | |
| Jul 25, 2013 | - | $12,048 | -3% | -49% | 38 | $317 | $5,676,634 | 42 |
| Jul 26, 2013 | - | $12,455 | +3% | -41% | 34 | $366 | $5,689,089 | 43 |
| Jul 27, 2013 | - | $18,832 | +51% | -32% | 34 | $554 | $5,707,921 | 44 |
| Jul 28, 2013 | - | $18,584 | -1% | -13% | 34 | $547 | $5,726,506 | 45 |
| Jul 29, 2013 | - | $5,966 | -68% | -45% | 34 | $175 | $5,732,472 | 46 |
| Jul 30, 2013 | - | $7,110 | +19% | 34 | $209 | $5,739,582 | 47 | |
| Jul 31, 2013 | - | $5,141 | -28% | -59% | 34 | $151 | $5,744,723 | 48 |
| Aug 1, 2013 | - | $5,637 | +10% | -53% | 34 | $166 | $5,750,360 | 49 |
| Aug 9, 2013 | - | $5,518 | 40 | $138 | $5,794,996 | 57 | ||
| Aug 10, 2013 | - | $6,813 | +23% | 40 | $170 | $5,801,809 | 58 | |
| Aug 11, 2013 | - | $4,650 | -32% | 40 | $116 | $5,806,460 | 59 | |
| Aug 19, 2013 | - | $916 | 18 | $51 | $5,825,439 | 67 | ||
| Aug 20, 2013 | - | $1,236 | +35% | 18 | $69 | $5,826,676 | 68 | |
| Aug 21, 2013 | - | $988 | -20% | 18 | $55 | $5,827,664 | 69 | |
| Aug 22, 2013 | - | $1,382 | +40% | 18 | $77 | $5,829,046 | 70 | |
| Aug 23, 2013 | - | $592 | -57% | 11 | $54 | $5,829,638 | 71 | |
| Aug 24, 2013 | - | $1,502 | +154% | 11 | $137 | $5,831,140 | 72 | |
| Aug 25, 2013 | - | $425 | -72% | 11 | $39 | $5,831,565 | 73 |
Weekly Box Office Performance
| Date | Rank | Gross | % Change | Theaters | Per Theater | Total Gross | Week |
|---|---|---|---|---|---|---|---|
| Jun 14, 2013 | 21 | $341,241 | 5 | $68,248 | $341,241 | 1 | |
| Jun 21, 2013 | 10 | $3,172,064 | +830% | 650 | $4,880 | $3,513,305 | 2 |
| Jun 28, 2013 | 17 | $1,283,811 | -60% | 630 | $2,038 | $4,797,117 | 3 |
| Jul 5, 2013 | 17 | $659,661 | -49% | 159 | $4,149 | $5,300,245 | 4 |
| Jul 12, 2013 | 28 | $258,346 | -61% | 97 | $2,663 | $5,558,591 | 5 |
| Jul 19, 2013 | 40 | $118,043 | -54% | 38 | $3,106 | $5,676,634 | 6 |
| Jul 26, 2013 | 44 | $73,726 | -38% | 34 | $2,168 | $5,750,360 | 7 |
| Aug 2, 2013 | 53 | $39,118 | -47% | 39 | $1,003 | $5,789,478 | 8 |
| Aug 9, 2013 | 63 | $26,120 | -33% | 40 | $653 | $5,818,740 | 9 |
| Aug 16, 2013 | 71 | $10,306 | -61% | 18 | $573 | $5,829,046 | 10 |
| Aug 23, 2013 | 78 | $5,731 | -44% | 7 | $819 | $5,834,777 | 11 |
| Aug 30, 2013 | 84 | $3,545 | -38% | 6 | $591 | $5,838,322 | 12 |
| Sep 6, 2013 | 84 | $4,686 | +32% | 13 | $360 | $5,845,732 | 13 |
Top International Territories
Box Office Summary Per Territory
| Territory | Release Date |
Opening Weekend |
Opening Weekend Screens/Theaters |
Maximum Screens/Theaters |
Theatrical Engagements |
Total Box Office |
Report Date |
|||
|---|---|---|---|---|---|---|---|---|---|---|
| Argentina | 10/24/2013 | $0 | 0 | 1 | 1 | $91,514 | 12/30/2018 | |||
| Australia | 8/8/2013 | $0 | 0 | 3 | 3 | $187,935 | 1/2/2024 | |||
| Rest of World | $6,282,310 | |||||||||
| International Total | $6,561,759 | 1/2/2024 | ||||||||
Note: Territories vary in whether they report screens or theaters. Full details on international box office data are available via our OpusData service.
Lead Ensemble Member
| Israel Broussard | Marc | |
| Katie Chang | Rebecca | |
| Taissa Farmiga | Sam | |
| Claire Julien | Chloe |
Supporting
| Georgia Rock | Emily |
Lead Ensemble Member
| Emma Watson | Nicki |
Supporting
| Leslie Mann | Laurie | |
| Gavin Rossdale | Ricky | |
| Carlos Miranda | Rob | |
| Stacy Edwards | Marc's Mom |
Production and Technical Credits
| Sofia Coppola | Director | |
| Sofia Coppola | Screenwriter | |
| Nancy Jo Sales | Story Creator | |
| Sofia Coppola | Producer | |
| Roman Coppola | Producer | |
| Youree Henley | Producer | |
| Michael Zakin | Executive Producer | |
| Francis Ford Coppola | Executive Producer | |
| Fred Roos | Executive Producer | |
| Paul Rassam | Executive Producer | |
| Emilio Diez Barroso | Executive Producer | |
| Darlene Caamano Loquet | Executive Producer | |
| Harris Savides | Director of Photography | |
| Christopher Blauvelt | Director of Photography | |
| Anne Ross | Production Designer | |
| Sarah Flack | Editor | |
| Brian Reitzell | Music Supervisor | |
| Stacey Battat | Costume Designer | |
| Courtney Bright | Casting Director | |
| Nicole Daniels | Casting Director |
Cast and crew with above-the-line roles are marked in bold. The line marks the division between above-the-line and below-the-line roles.
Full financial estimates for this film, including domestic and international box office, video sales, video rentals, TV and ancillary revenue are available through our research services. For more information, please contact us at research@the-numbers.com.