D.C. Cab (1983)
| Theatrical Performance | ||
| Domestic Box Office | $16,134,000 | Details |
| OpusData ID: 29040100 More info... | ||
| Further financial details... | ||
Synopsis
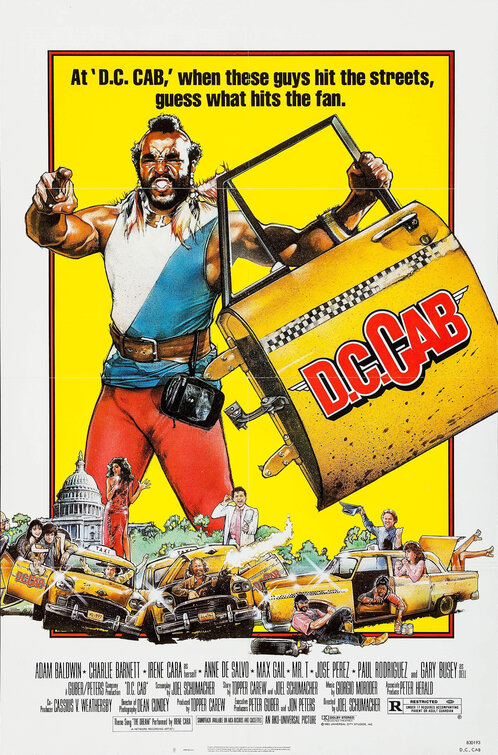
When young Albert Hockenberry wants to become a cabbie, he’s got the wackiest teachers around, courtesy of his uncle Howard and the freewheeling D.C. Cab Co., including Samson and Dell. Along the way, Albert falls in love with beautiful waitress Claudette and gets caught up in a kidnapping, with Mr. T and the other cabbies riding to the rescue.
Metrics
| Opening Weekend: | $1,564,530 (9.7% of total gross) |
| Legs: | 6.20 (domestic box office/biggest weekend) |
| Domestic Share: | 100.0% (domestic box office/worldwide) |
| Theater counts: | 862 opening theaters/908 max. theaters, 5.7 weeks average run per theater |
| Infl. Adj. Dom. BO | $56,760,377 |
Movie Details
| Domestic Releases: | December 16th, 1983 (Wide) by Universal |
| Video Release: | January 15th, 1997 by Universal Home Entertainment |
| MPA Rating: | R |
| Running Time: | 100 minutes |
| Plot point: | Kidnap, Relationships Gone Wrong, Rescue, Taxi Driver |
| Subgenre: | Farcical / Slapstick Comedy |
| Source: | Based on Fiction Book/Short Story |
| Genre: | Comedy |
| Production Method: | Live Action |
| Creative Type: | Contemporary Fiction |
| Production Countries: | United States |
| Languages: | English |
Weekend Box Office Performance
| Date | Rank | Gross | % Change | Theaters | Per Theater | Total Gross | Week |
|---|---|---|---|---|---|---|---|
| Dec 16, 1983 | 9 | $1,564,530 | 862 | $1,815 | $1,564,530 | 1 | |
| Dec 23, 1983 | 10 | $1,748,000 | +12% | 874 | $2,000 | $4,028,649 | 2 |
| Dec 30, 1983 | 10 | $2,601,420 | +49% | 908 | $2,865 | $7,817,420 | 3 |
| Jan 6, 1984 | 9 | $1,719,650 | -34% | 815 | $2,110 | $9,942,650 | 4 |
| Jan 13, 1984 | 14 | $1,082,880 | -37% | 686 | $1,579 | $11,320,880 | 5 |
| Jan 20, 1984 | 15 | $669,300 | -38% | 582 | $1,150 | $12,275,300 | 6 |
| Jan 27, 1984 | 16 | $553,880 | -17% | 488 | $1,135 | $13,023,880 | 7 |
Weekly Box Office Performance
| Date | Rank | Gross | % Change | Theaters | Per Theater | Total Gross | Week |
|---|---|---|---|---|---|---|---|
| Dec 16, 1983 | 9 | $2,280,649 | 862 | $2,646 | $2,280,649 | 1 | |
| Dec 23, 1983 | 10 | $2,935,351 | +29% | 874 | $3,359 | $5,216,000 | 2 |
| Dec 30, 1983 | 10 | $3,007,000 | +2% | 908 | $3,312 | $8,223,000 | 3 |
| Jan 6, 1984 | 11 | $2,015,000 | -33% | 815 | $2,472 | $10,238,000 | 4 |
| Jan 13, 1984 | 14 | $1,368,000 | -32% | 686 | $1,994 | $11,606,000 | 5 |
| Jan 20, 1984 | 15 | $864,000 | -37% | 582 | $1,485 | $12,470,000 | 6 |
Lead Ensemble Member
| Adam Baldwin | Albert Hockenberry | |
| Charlie Barnett | Tyrone | |
| Irene Cara | ||
| Anne De Salvo | Myrna | |
| Max Gail | Harold | |
| Mr. T | Samson | |
| Jose Perez | ||
| Paul Rodriguez | ||
| Gary Busey | Dell |
Supporting
| Jill Schoelen | Claudette | |
| John Diehl | Head Kidnapper |
Production and Technical Credits
| Joel Schumacher | Director | |
| Joel Schumacher | Screenwriter |
Cast and crew with above-the-line roles are marked in bold. The line marks the division between above-the-line and below-the-line roles.
Synopsis
When young Albert Hockenberry wants to become a cabbie, he’s got the wackiest teachers around, courtesy of his uncle Howard and the freewheeling D.C. Cab Co., including Samson and Dell. Along the way, Albert falls in love with beautiful waitress Claudette and gets caught up in a kidnapping, with Mr. T and the other cabbies riding to the rescue.
Metrics
| Opening Weekend: | $1,564,530 (9.7% of total gross) |
| Legs: | 6.20 (domestic box office/biggest weekend) |
| Domestic Share: | 100.0% (domestic box office/worldwide) |
| Theater counts: | 862 opening theaters/908 max. theaters, 5.7 weeks average run per theater |
| Infl. Adj. Dom. BO | $56,760,377 |
Movie Details
| Domestic Releases: | December 16th, 1983 (Wide) by Universal |
| Video Release: | January 15th, 1997 by Universal Home Entertainment |
| MPA Rating: | R |
| Running Time: | 100 minutes |
| Plot point: | Kidnap, Relationships Gone Wrong, Rescue, Taxi Driver |
| Subgenre: | Farcical / Slapstick Comedy |
| Source: | Based on Fiction Book/Short Story |
| Genre: | Comedy |
| Production Method: | Live Action |
| Creative Type: | Contemporary Fiction |
| Production Countries: | United States |
| Languages: | English |
Weekend Box Office Performance
| Date | Rank | Gross | % Change | Theaters | Per Theater | Total Gross | Week |
|---|---|---|---|---|---|---|---|
| Dec 16, 1983 | 9 | $1,564,530 | 862 | $1,815 | $1,564,530 | 1 | |
| Dec 23, 1983 | 10 | $1,748,000 | +12% | 874 | $2,000 | $4,028,649 | 2 |
| Dec 30, 1983 | 10 | $2,601,420 | +49% | 908 | $2,865 | $7,817,420 | 3 |
| Jan 6, 1984 | 9 | $1,719,650 | -34% | 815 | $2,110 | $9,942,650 | 4 |
| Jan 13, 1984 | 14 | $1,082,880 | -37% | 686 | $1,579 | $11,320,880 | 5 |
| Jan 20, 1984 | 15 | $669,300 | -38% | 582 | $1,150 | $12,275,300 | 6 |
| Jan 27, 1984 | 16 | $553,880 | -17% | 488 | $1,135 | $13,023,880 | 7 |
Weekly Box Office Performance
| Date | Rank | Gross | % Change | Theaters | Per Theater | Total Gross | Week |
|---|---|---|---|---|---|---|---|
| Dec 16, 1983 | 9 | $2,280,649 | 862 | $2,646 | $2,280,649 | 1 | |
| Dec 23, 1983 | 10 | $2,935,351 | +29% | 874 | $3,359 | $5,216,000 | 2 |
| Dec 30, 1983 | 10 | $3,007,000 | +2% | 908 | $3,312 | $8,223,000 | 3 |
| Jan 6, 1984 | 11 | $2,015,000 | -33% | 815 | $2,472 | $10,238,000 | 4 |
| Jan 13, 1984 | 14 | $1,368,000 | -32% | 686 | $1,994 | $11,606,000 | 5 |
| Jan 20, 1984 | 15 | $864,000 | -37% | 582 | $1,485 | $12,470,000 | 6 |
Lead Ensemble Member
| Adam Baldwin | Albert Hockenberry | |
| Charlie Barnett | Tyrone | |
| Irene Cara | ||
| Anne De Salvo | Myrna | |
| Max Gail | Harold | |
| Mr. T | Samson | |
| Jose Perez | ||
| Paul Rodriguez | ||
| Gary Busey | Dell |
Supporting
| Jill Schoelen | Claudette | |
| John Diehl | Head Kidnapper |
Production and Technical Credits
| Joel Schumacher | Director | |
| Joel Schumacher | Screenwriter |
Cast and crew with above-the-line roles are marked in bold. The line marks the division between above-the-line and below-the-line roles.