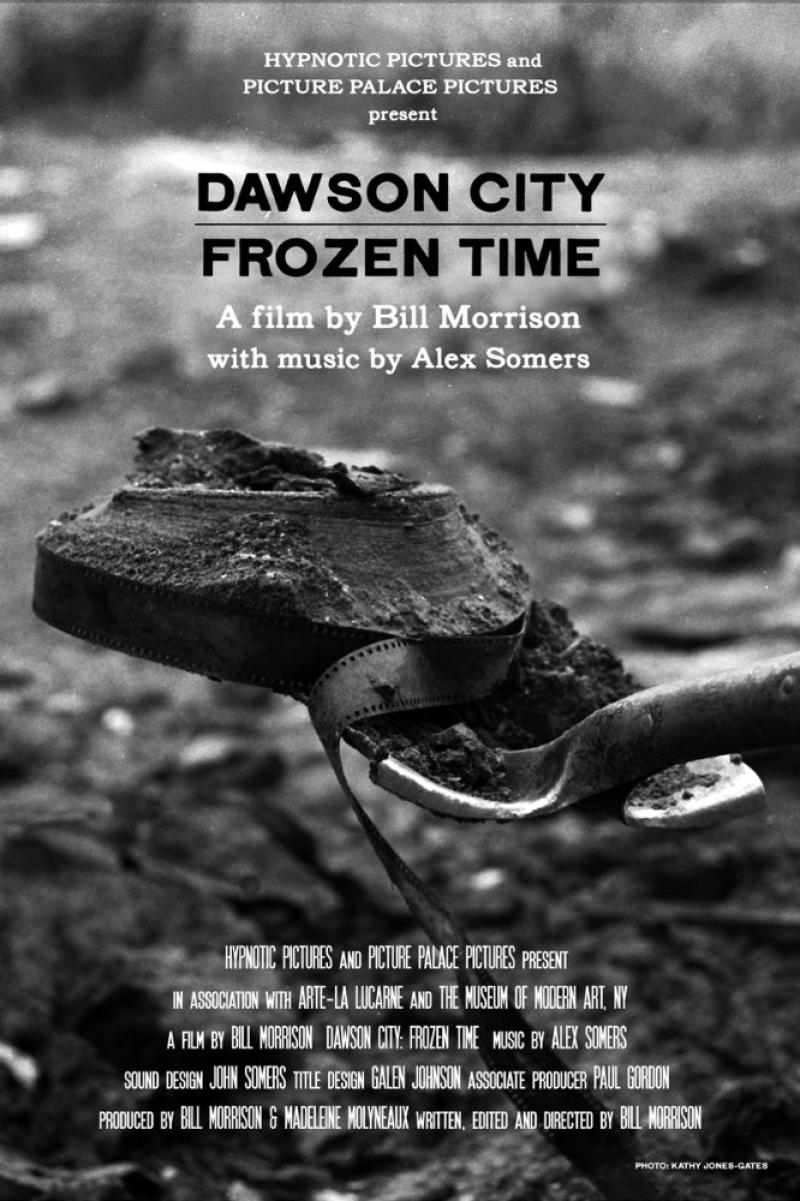
Dawson City: Frozen Time (2017)
| Theatrical Performance | ||
| Domestic Box Office | $132,369 | Details |
| OpusData ID: 287050100 More info... | ||
| Further financial details... | ||
Synopsis
This meditation on cinema’s past from Decasia director Bill Morrison pieces together the bizarre true history of a long-lost collection of 533 nitrate film prints from the early 1900s. Located just south of the Arctic Circle, Dawson City was settled in 1896 and became the center of the Canadian Gold Rush that brought 100,000 prospectors to the area. It was also the final stop for a distribution chain that sent prints and newsreels to the Yukon. The films were seldom, if ever, returned. The now-famous Dawson City Collection was uncovered in 1978 when a bulldozer working its way through a parking lot dug up a horde of film cans. Dawson City: Frozen Time depicts the unique history of this Canadian Gold Rush town by chronicling the life cycle of a singular film collection through its exile, burial, rediscovery, and salvation.
Metrics
| Opening Weekend: | $5,713 (4.3% of total gross) |
| Legs: | 8.31 (domestic box office/biggest weekend) |
| Domestic Share: | 100.0% (domestic box office/worldwide) |
| Theater counts: | 1 opening theaters/6 max. theaters, 11.3 weeks average run per theater |
| Infl. Adj. Dom. BO | $176,494 |
Movie Details
| Domestic Releases: | June 9th, 2017 (Limited) by Kino Lorber |
| MPA Rating: | Not Rated |
| Running Time: | 120 minutes |
| Cast, crew, or production detail: | Archive Footage |
| Geographical setting: | Yukon |
| Social setting: | Movie Business |
| Time period setting: | 1910s, 1920s |
| Source: | Based on Real Life Events |
| Genre: | Documentary |
| Production Method: | Live Action |
| Creative Type: | Factual |
| Production/Financing Companies: | Hypnotic Pictures, Picture Palace Films, Arte, The Museum of Modern Art |
| Production Countries: | United States |
| Languages: | English |
Weekend Box Office Performance
| Date | Rank | Gross | % Change | Theaters | Per Theater | Total Gross | Week |
|---|---|---|---|---|---|---|---|
| Jun 9, 2017 | 59 | $5,713 | 1 | $5,713 | $5,713 | 1 | |
| Jun 16, 2017 | 47 | $15,922 | +179% | 4 | $3,981 | $25,816 | 2 |
| Jun 23, 2017 | 54 | $10,470 | -34% | 6 | $1,745 | $45,957 | 3 |
| Jun 30, 2017 | 58 | $6,656 | -36% | 6 | $1,109 | $59,266 | 4 |
| Jul 7, 2017 | 68 | $4,264 | -36% | 4 | $1,066 | $68,762 | 5 |
| Jul 14, 2017 | 65 | $3,820 | -10% | 5 | $764 | $75,417 | 6 |
| Jul 21, 2017 | 59 | $4,029 | +5% | 4 | $1,007 | $82,898 | 7 |
| Jul 28, 2017 | 71 | $3,164 | -21% | 3 | $1,055 | $91,217 | 8 |
| Aug 4, 2017 | 66 | $3,790 | +20% | 5 | $758 | $98,966 | 9 |
| Aug 11, 2017 | 69 | $3,678 | -3% | 6 | $613 | $104,644 | 10 |
| Aug 18, 2017 | 86 | $1,324 | -64% | 4 | $331 | $109,153 | 11 |
| Aug 25, 2017 | 92 | $1,366 | +3% | 4 | $342 | $111,619 | 12 |
| Sep 1, 2017 | 105 | $1,106 | -19% | 3 | $369 | $115,455 | 13 |
| Sep 8, 2017 | 118 | $119 | -89% | 2 | $60 | $117,918 | 14 |
| Sep 15, 2017 | 101 | $938 | +688% | 3 | $313 | $118,997 | 15 |
| Sep 22, 2017 | 97 | $758 | -19% | 3 | $253 | $120,635 | 16 |
| Sep 29, 2017 | 102 | $884 | +17% | 2 | $442 | $122,207 | 17 |
| Oct 27, 2017 | 107 | $270 | 1 | $270 | $129,756 | 21 | |
| Nov 3, 2017 | 100 | $262 | -3% | 1 | $262 | $130,270 | 22 |
| Dec 1, 2017 | 79 | $1,843 | 1 | $1,843 | $132,369 | 26 |
Weekly Box Office Performance
| Date | Rank | Gross | % Change | Theaters | Per Theater | Total Gross | Week |
|---|---|---|---|---|---|---|---|
| Jun 9, 2017 | 55 | $9,894 | 1 | $9,894 | $9,894 | 1 | |
| Jun 16, 2017 | 48 | $25,593 | +159% | 4 | $6,398 | $35,487 | 2 |
| Jun 23, 2017 | 55 | $17,123 | -33% | 6 | $2,854 | $52,610 | 3 |
| Jun 30, 2017 | 61 | $11,888 | -31% | 6 | $1,981 | $64,498 | 4 |
| Jul 7, 2017 | 68 | $7,099 | -40% | 4 | $1,775 | $71,597 | 5 |
| Jul 14, 2017 | 60 | $7,272 | +2% | 5 | $1,454 | $78,869 | 6 |
| Jul 21, 2017 | 56 | $9,184 | +26% | 4 | $2,296 | $88,053 | 7 |
| Jul 28, 2017 | 66 | $7,123 | -22% | 6 | $1,187 | $95,176 | 8 |
| Aug 4, 2017 | 65 | $5,790 | -19% | 5 | $1,158 | $100,966 | 9 |
| Aug 11, 2017 | 70 | $6,863 | +19% | 6 | $1,144 | $107,829 | 10 |
| Aug 18, 2017 | 88 | $2,424 | -65% | 4 | $606 | $110,253 | 11 |
| Aug 25, 2017 | 84 | $4,096 | +69% | 4 | $1,024 | $114,349 | 12 |
| Sep 1, 2017 | 95 | $3,450 | -16% | 3 | $1,150 | $117,799 | 13 |
| Sep 8, 2017 | 115 | $260 | -92% | 2 | $130 | $118,059 | 14 |
| Sep 15, 2017 | 102 | $1,818 | +599% | 5 | $364 | $119,877 | 15 |
| Sep 22, 2017 | 104 | $1,446 | -20% | 3 | $482 | $121,323 | 16 |
| Sep 29, 2017 | 99 | $1,789 | +24% | 2 | $895 | $123,112 | 17 |
| Oct 6, 2017 | 91 | $3,439 | +92% | 3 | $1,146 | $126,551 | 18 |
| Oct 13, 2017 | 84 | $2,935 | -15% | 5 | $587 | $129,486 | 19 |
| Oct 27, 2017 | 107 | $522 | 1 | $522 | $130,008 | 21 |
Full financial estimates for this film, including domestic and international box office, video sales, video rentals, TV and ancillary revenue are available through our research services. For more information, please contact us at research@the-numbers.com.