Elstree 1976 (2016)
| Theatrical Performance | ||
| Domestic Box Office | $12,173 | Details |
| OpusData ID: 258100100 More info... | ||
| Further financial details... | ||
Synopsis
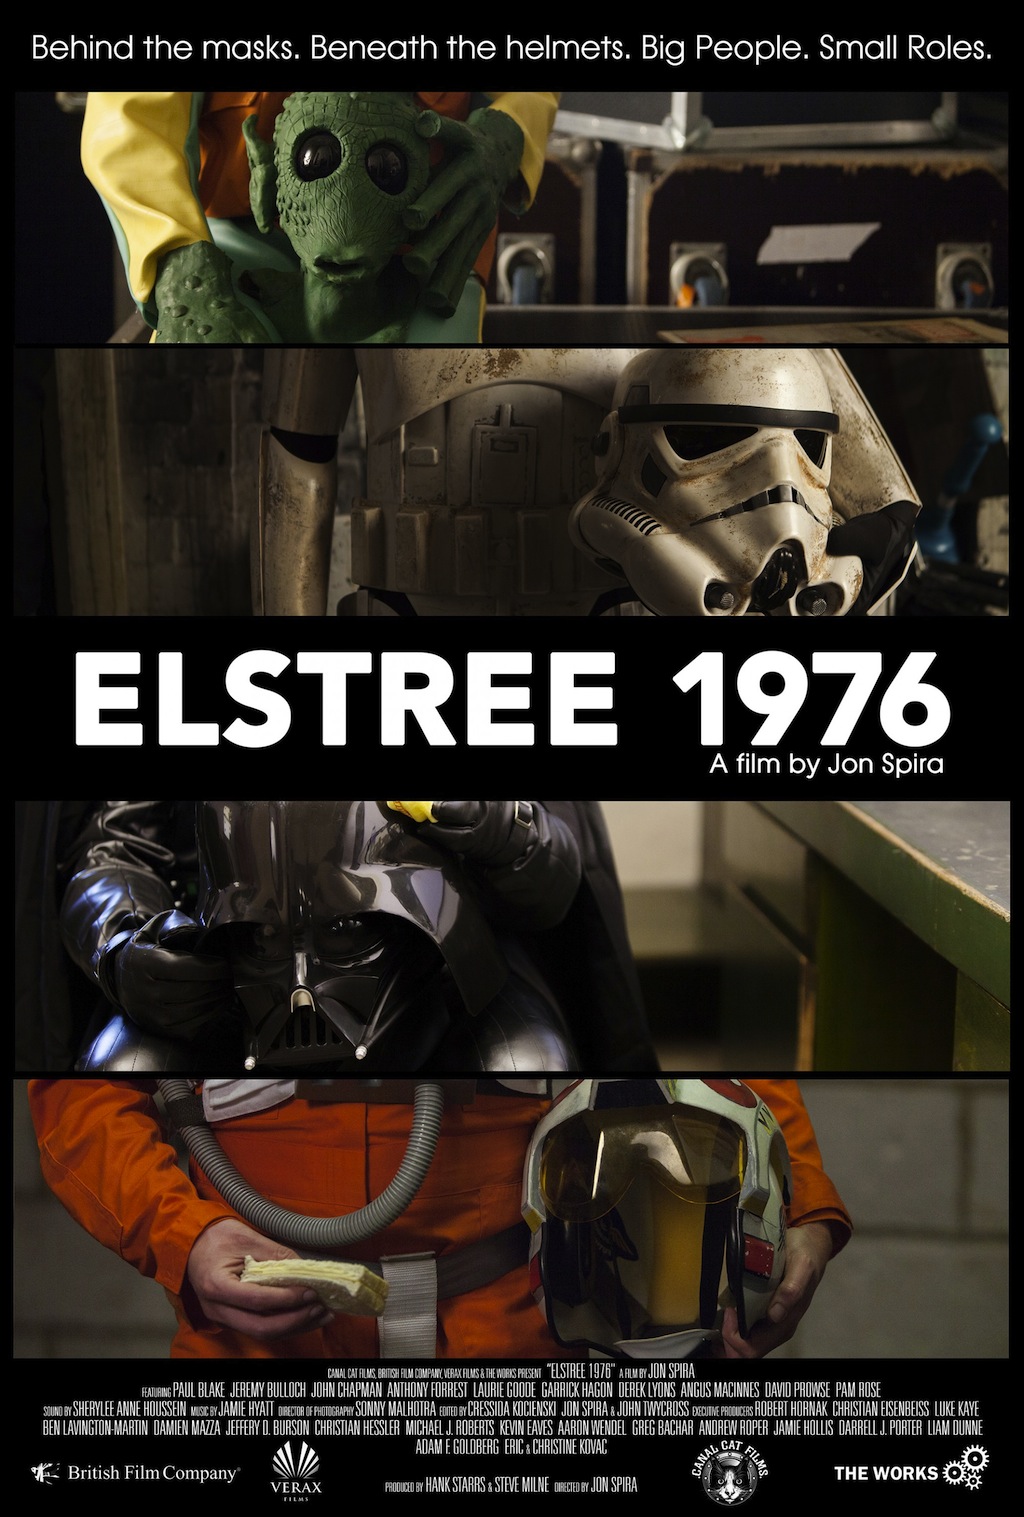
A Star Wars-themed documentary crowd-funded by the series’ famously devoted fan-base, this film explores the lives of the bit players and extras behind one of the most celebrated franchises in cinematic history.
Metrics
| Opening Weekend: | $3,270 (26.9% of total gross) |
| Legs: | 3.72 (domestic box office/biggest weekend) |
| Domestic Share: | 100.0% (domestic box office/worldwide) |
| Theater counts: | 14 opening theaters/14 max. theaters, 1.7 weeks average run per theater |
| Infl. Adj. Dom. BO | $16,828 |
Movie Details
| Domestic Releases: | May 6th, 2016 (Limited) by FilmRise |
| Video Release: | May 6th, 2016 by FilmRise |
| MPA Rating: | Not Rated |
| Running Time: | 104 minutes |
| Cast, crew, or production detail: | Archive Footage, Crowdfunding |
| Release detail: | Early / Simultaneous Video-on-Demand release |
| Source: | Based on Real Life Events |
| Genre: | Documentary |
| Production Method: | Live Action |
| Creative Type: | Factual |
| Production/Financing Companies: | Canal Cat Films, British Film Company, Verax Films, The Works International |
| Production Countries: | United Kingdom |
| Languages: | English |
Weekend Box Office Performance
| Date | Rank | Gross | % Change | Theaters | Per Theater | Total Gross | Week |
|---|---|---|---|---|---|---|---|
| May 6, 2016 | 80 | $3,270 | 14 | $234 | $3,270 | 1 | |
| May 13, 2016 | 92 | $1,000 | -69% | 3 | $333 | $7,093 | 2 |
| May 20, 2016 | 95 | $1,161 | +16% | 2 | $581 | $9,431 | 3 |
| May 27, 2016 | 89 | $623 | -46% | 3 | $208 | $10,847 | 4 |
| Jun 3, 2016 | 89 | $376 | -40% | 2 | $188 | $11,757 | 5 |
Weekly Box Office Performance
| Date | Rank | Gross | % Change | Theaters | Per Theater | Total Gross | Week |
|---|---|---|---|---|---|---|---|
| May 6, 2016 | 83 | $6,093 | 14 | $435 | $6,093 | 1 | |
| May 13, 2016 | 100 | $2,177 | -64% | 3 | $726 | $8,270 | 2 |
| May 20, 2016 | 97 | $1,954 | -10% | 2 | $977 | $10,224 | 3 |
| May 27, 2016 | 97 | $1,152 | -41% | 3 | $384 | $11,381 | 4 |
| Jun 3, 2016 | 95 | $792 | -31% | 2 | $396 | $12,173 | 5 |
Full financial estimates for this film, including domestic and international box office, video sales, video rentals, TV and ancillary revenue are available through our research services. For more information, please contact us at research@the-numbers.com.
Synopsis
A Star Wars-themed documentary crowd-funded by the series’ famously devoted fan-base, this film explores the lives of the bit players and extras behind one of the most celebrated franchises in cinematic history.
Metrics
| Opening Weekend: | $3,270 (26.9% of total gross) |
| Legs: | 3.72 (domestic box office/biggest weekend) |
| Domestic Share: | 100.0% (domestic box office/worldwide) |
| Theater counts: | 14 opening theaters/14 max. theaters, 1.7 weeks average run per theater |
| Infl. Adj. Dom. BO | $16,828 |
Movie Details
| Domestic Releases: | May 6th, 2016 (Limited) by FilmRise |
| Video Release: | May 6th, 2016 by FilmRise |
| MPA Rating: | Not Rated |
| Running Time: | 104 minutes |
| Cast, crew, or production detail: | Archive Footage, Crowdfunding |
| Release detail: | Early / Simultaneous Video-on-Demand release |
| Source: | Based on Real Life Events |
| Genre: | Documentary |
| Production Method: | Live Action |
| Creative Type: | Factual |
| Production/Financing Companies: | Canal Cat Films, British Film Company, Verax Films, The Works International |
| Production Countries: | United Kingdom |
| Languages: | English |
Weekend Box Office Performance
| Date | Rank | Gross | % Change | Theaters | Per Theater | Total Gross | Week |
|---|---|---|---|---|---|---|---|
| May 6, 2016 | 80 | $3,270 | 14 | $234 | $3,270 | 1 | |
| May 13, 2016 | 92 | $1,000 | -69% | 3 | $333 | $7,093 | 2 |
| May 20, 2016 | 95 | $1,161 | +16% | 2 | $581 | $9,431 | 3 |
| May 27, 2016 | 89 | $623 | -46% | 3 | $208 | $10,847 | 4 |
| Jun 3, 2016 | 89 | $376 | -40% | 2 | $188 | $11,757 | 5 |
Weekly Box Office Performance
| Date | Rank | Gross | % Change | Theaters | Per Theater | Total Gross | Week |
|---|---|---|---|---|---|---|---|
| May 6, 2016 | 83 | $6,093 | 14 | $435 | $6,093 | 1 | |
| May 13, 2016 | 100 | $2,177 | -64% | 3 | $726 | $8,270 | 2 |
| May 20, 2016 | 97 | $1,954 | -10% | 2 | $977 | $10,224 | 3 |
| May 27, 2016 | 97 | $1,152 | -41% | 3 | $384 | $11,381 | 4 |
| Jun 3, 2016 | 95 | $792 | -31% | 2 | $396 | $12,173 | 5 |
Full financial estimates for this film, including domestic and international box office, video sales, video rentals, TV and ancillary revenue are available through our research services. For more information, please contact us at research@the-numbers.com.