Faith of Our Fathers (2015)
| Theatrical Performance | ||
| Domestic Box Office | $1,004,105 | Details |
| Domestic Physical Disc Sales | ||
| DVD Sales (estimated) | $981,624 | |
| Total | $981,624 | |
| OpusData ID: 227600100 More info... | ||
| Further financial details... | ||
Synopsis
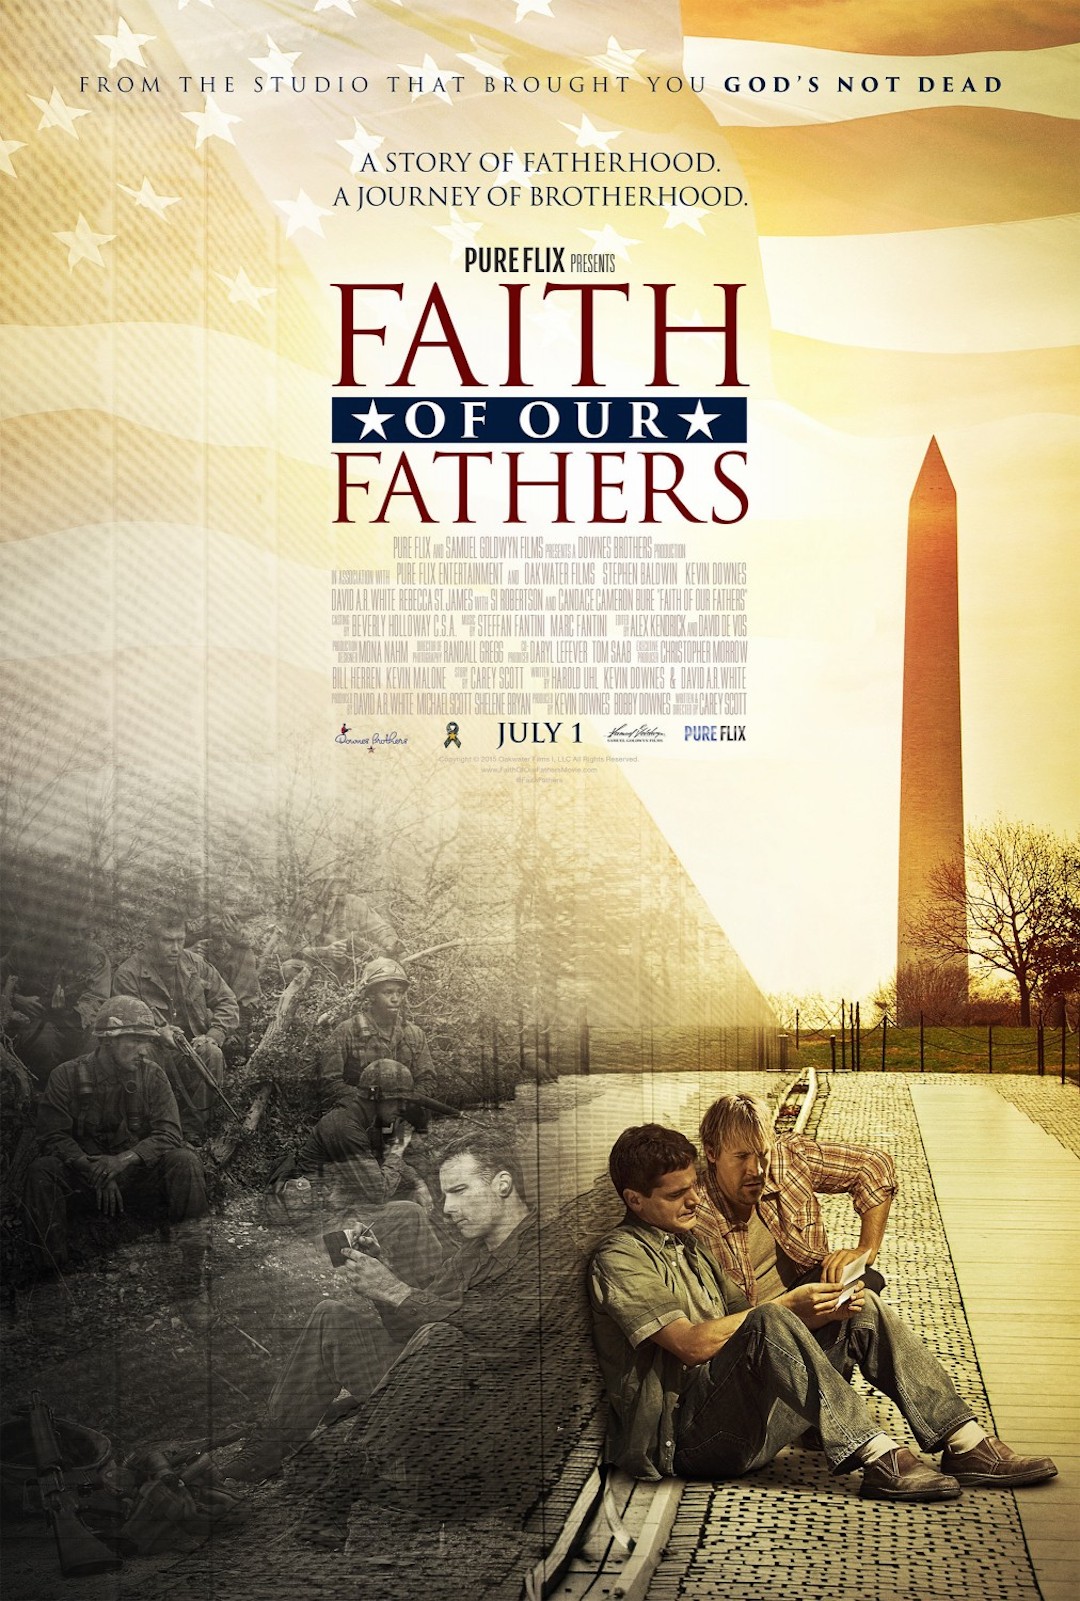
With the Vietnam War raging in 1969, two young fathers report for duty. A man of great faith and a doubtful cynic. A quarter-century later, their sons, Wayne and John Paul, meet as strangers. Guided by handwritten letters from their fathers from the battlefield, they embark on an unforgettable journey to The Wall—the Vietnam Veterans Memorial in Washington, D.C. Along the way, they discover the devastation of war cannot break the love of a father for his son.
Metrics
| Opening Weekend: | $438,186 (43.6% of total gross) |
| Legs: | 2.29 (domestic box office/biggest weekend) |
| Domestic Share: | 100.0% (domestic box office/worldwide) |
| Theater counts: | 344 opening theaters/344 max. theaters, 1.7 weeks average run per theater |
| Infl. Adj. Dom. BO | $1,424,568 |
Movie Details
| Domestic Releases: | July 1st, 2015 (Limited) by Pure Flix / Samuel Goldwyn Films |
| Video Release: | October 13th, 2015 by Cinedigm |
| MPA Rating: | PG-13 for brief war violence. (Rating bulletin 2370, 4/21/2015) |
| Running Time: | 93 minutes |
| Geographical setting: | Washington, D.C. |
| Plot point: | Christians, Road Trip |
| Social setting: | Vietnam War |
| Target audience: | Faith-Based Film |
| Source: | Original Screenplay |
| Genre: | Drama |
| Production Method: | Live Action |
| Creative Type: | Contemporary Fiction |
| Production/Financing Companies: | Downes Brothers Productions, Pure Flix, Oak Water Films |
| Production Countries: | United States |
| Languages: | English |
Weekend Box Office Performance
| Date | Rank | Gross | % Change | Theaters | Per Theater | Total Gross | Week |
|---|---|---|---|---|---|---|---|
| Jul 3, 2015 | 17 | $438,186 | 344 | $1,274 | $626,977 | 1 | |
| Jul 10, 2015 | 31 | $82,188 | -81% | 154 | $534 | $892,093 | 2 |
| Jul 17, 2015 | 49 | $27,717 | -66% | 52 | $533 | $953,592 | 3 |
| Jul 24, 2015 | 75 | $5,157 | -81% | 17 | $303 | $975,407 | 4 |
| Jul 31, 2015 | 75 | $3,024 | -41% | 6 | $504 | $981,982 | 5 |
| Aug 7, 2015 | 81 | $2,014 | -33% | 6 | $336 | $986,535 | 6 |
| Aug 14, 2015 | 68 | $8,257 | +310% | 3 | $2,752 | $995,807 | 7 |
Daily Box Office Performance
| Date | Rank | Gross | %YD | %LW | Theaters | Per Theater | Total Gross | Days |
|---|---|---|---|---|---|---|---|---|
| Jul 1, 2015 | - | $99,867 | 344 | $290 | $99,867 | 1 | ||
| Jul 2, 2015 | - | $88,924 | -11% | 344 | $259 | $188,791 | 2 | |
| Jul 3, 2015 | - | $179,063 | +101% | 344 | $521 | $367,854 | 3 | |
| Jul 4, 2015 | - | $145,000 | -19% | 344 | $422 | $512,854 | 4 | |
| Jul 5, 2015 | - | $114,186 | -21% | 344 | $332 | $627,040 | 5 | |
| Jul 6, 2015 | - | $43,652 | -62% | 344 | $127 | $670,692 | 6 | |
| Jul 7, 2015 | - | $61,405 | +41% | 344 | $179 | $732,097 | 7 | |
| Jul 8, 2015 | - | $42,270 | -31% | -58% | 344 | $123 | $774,367 | 8 |
| Jul 9, 2015 | - | $35,601 | -16% | -60% | 344 | $103 | $799,968 | 9 |
| Jul 10, 2015 | - | $24,245 | -32% | -86% | 154 | $157 | $824,213 | 10 |
| Jul 11, 2015 | - | $34,225 | +41% | -76% | 154 | $222 | $858,438 | 11 |
| Jul 12, 2015 | - | $23,718 | -31% | -79% | 154 | $154 | $882,156 | 12 |
| Jul 13, 2015 | - | $9,833 | -59% | -77% | 138 | $71 | $891,989 | 13 |
| Jul 14, 2015 | - | $13,090 | +33% | -79% | 138 | $95 | $905,079 | 14 |
| Jul 15, 2015 | - | $10,952 | -16% | -74% | 138 | $79 | $916,031 | 15 |
| Jul 16, 2015 | - | $9,763 | -11% | -73% | 138 | $71 | $925,794 | 16 |
| Jul 17, 2015 | - | $7,837 | -20% | -68% | 52 | $151 | $933,631 | 17 |
| Jul 18, 2015 | - | $11,119 | +42% | -68% | 52 | $214 | $944,750 | 18 |
| Jul 19, 2015 | - | $8,761 | -21% | -63% | 52 | $168 | $953,511 | 19 |
| Jul 20, 2015 | - | $3,400 | -61% | -65% | 52 | $65 | $956,911 | 20 |
| Jul 21, 2015 | - | $4,638 | +36% | -65% | 52 | $89 | $961,549 | 21 |
| Jul 22, 2015 | - | $4,651 | n/c | -58% | 52 | $89 | $966,200 | 22 |
| Jul 23, 2015 | - | $4,050 | -13% | -59% | 52 | $78 | $970,250 | 23 |
| Jul 24, 2015 | - | $1,549 | -62% | -80% | 17 | $91 | $971,799 | 24 |
| Jul 25, 2015 | - | $1,947 | +26% | -82% | 17 | $115 | $973,746 | 25 |
| Jul 26, 2015 | - | $1,661 | -15% | -81% | 17 | $98 | $975,407 | 26 |
| Jul 27, 2015 | - | $629 | -62% | -82% | 17 | $37 | $976,036 | 27 |
| Jul 28, 2015 | - | $821 | +31% | -82% | 17 | $48 | $976,857 | 28 |
| Jul 29, 2015 | - | $1,093 | +33% | -76% | 17 | $64 | $977,950 | 29 |
| Jul 30, 2015 | - | $1,008 | -8% | -75% | 17 | $59 | $978,958 | 30 |
| Jul 31, 2015 | - | $722 | -28% | -53% | 6 | $120 | $979,680 | 31 |
| Aug 1, 2015 | - | $1,247 | +73% | -36% | 6 | $208 | $980,927 | 32 |
| Aug 2, 2015 | - | $1,055 | -15% | -36% | 6 | $176 | $981,982 | 33 |
Weekly Box Office Performance
| Date | Rank | Gross | % Change | Theaters | Per Theater | Total Gross | Week |
|---|---|---|---|---|---|---|---|
| Jun 26, 2015 | 32 | $188,791 | 344 | $549 | $188,791 | 1 | |
| Jul 3, 2015 | 18 | $611,114 | +224% | 344 | $1,776 | $799,905 | 2 |
| Jul 10, 2015 | 32 | $125,970 | -79% | 138 | $913 | $925,875 | 3 |
| Jul 17, 2015 | 51 | $44,375 | -65% | 52 | $853 | $970,250 | 4 |
| Jul 24, 2015 | 76 | $8,708 | -80% | 17 | $512 | $978,958 | 5 |
| Jul 31, 2015 | 77 | $5,563 | -36% | 6 | $927 | $984,521 | 6 |
| Aug 7, 2015 | 87 | $3,029 | -46% | 6 | $505 | $987,550 | 7 |
| Aug 14, 2015 | 68 | $13,932 | +360% | 3 | $4,644 | $1,001,482 | 8 |
| Aug 28, 2015 | 103 | $1,039 | 3 | $346 | $1,004,105 | 10 |
Leading
| Stephen Baldwin | Sgt. Mansfield | |
| Kevin Downes | John Paul | |
| David A.R. White | Wayne |
Supporting
| Rebecca St. James | Annie |
Cameo
| Si Robertson | Himself |
Supporting
| Candace Cameron Bure | Cynthia | |
| Scott Whyte | Eddie Adams | |
| Sean McGowan | Stephen George | |
| Ryan Doom | Pvt. Shears | |
| Sean Sedgwick | Pvt. Burgess |
Production and Technical Credits
| Carey Scott | Director | |
| Carey Scott | Screenwriter | |
| Harold Uhl | Screenwriter | |
| Kevin Downes | Screenwriter | |
| David A.R. White | Screenwriter | |
| Kevin Downes | Producer | |
| Bobby Downes | Producer | |
| David A.R. White | Producer | |
| Michael Scott | Producer | |
| Shelene Bryan | Producer | |
| Carey Scott | Story Creator | |
| Christopher Morrow | Executive Producer | |
| Bill Herren | Executive Producer | |
| Kevin Maloney | Executive Producer | |
| Daryl Lefever | Co-Producer | |
| Tom Saab | Co-Producer | |
| Randall Gregg | Director of Photography | |
| Mona Nahm | Production Designer | |
| Alex Kendrick | Editor | |
| David De Vos | Editor | |
| Steffan Fantini | Composer | |
| Marc Fantini | Composer | |
| Beverly Holloway | Casting Director |
Cast and crew with above-the-line roles are marked in bold. The line marks the division between above-the-line and below-the-line roles.
Full financial estimates for this film, including domestic and international box office, video sales, video rentals, TV and ancillary revenue are available through our research services. For more information, please contact us at research@the-numbers.com.
Synopsis
With the Vietnam War raging in 1969, two young fathers report for duty. A man of great faith and a doubtful cynic. A quarter-century later, their sons, Wayne and John Paul, meet as strangers. Guided by handwritten letters from their fathers from the battlefield, they embark on an unforgettable journey to The Wall—the Vietnam Veterans Memorial in Washington, D.C. Along the way, they discover the devastation of war cannot break the love of a father for his son.
Metrics
| Opening Weekend: | $438,186 (43.6% of total gross) |
| Legs: | 2.29 (domestic box office/biggest weekend) |
| Domestic Share: | 100.0% (domestic box office/worldwide) |
| Theater counts: | 344 opening theaters/344 max. theaters, 1.7 weeks average run per theater |
| Infl. Adj. Dom. BO | $1,424,568 |
Movie Details
| Domestic Releases: | July 1st, 2015 (Limited) by Pure Flix / Samuel Goldwyn Films |
| Video Release: | October 13th, 2015 by Cinedigm |
| MPA Rating: | PG-13 for brief war violence. (Rating bulletin 2370, 4/21/2015) |
| Running Time: | 93 minutes |
| Geographical setting: | Washington, D.C. |
| Plot point: | Christians, Road Trip |
| Social setting: | Vietnam War |
| Target audience: | Faith-Based Film |
| Source: | Original Screenplay |
| Genre: | Drama |
| Production Method: | Live Action |
| Creative Type: | Contemporary Fiction |
| Production/Financing Companies: | Downes Brothers Productions, Pure Flix, Oak Water Films |
| Production Countries: | United States |
| Languages: | English |
Weekend Box Office Performance
| Date | Rank | Gross | % Change | Theaters | Per Theater | Total Gross | Week |
|---|---|---|---|---|---|---|---|
| Jul 3, 2015 | 17 | $438,186 | 344 | $1,274 | $626,977 | 1 | |
| Jul 10, 2015 | 31 | $82,188 | -81% | 154 | $534 | $892,093 | 2 |
| Jul 17, 2015 | 49 | $27,717 | -66% | 52 | $533 | $953,592 | 3 |
| Jul 24, 2015 | 75 | $5,157 | -81% | 17 | $303 | $975,407 | 4 |
| Jul 31, 2015 | 75 | $3,024 | -41% | 6 | $504 | $981,982 | 5 |
| Aug 7, 2015 | 81 | $2,014 | -33% | 6 | $336 | $986,535 | 6 |
| Aug 14, 2015 | 68 | $8,257 | +310% | 3 | $2,752 | $995,807 | 7 |
Daily Box Office Performance
| Date | Rank | Gross | %YD | %LW | Theaters | Per Theater | Total Gross | Days |
|---|---|---|---|---|---|---|---|---|
| Jul 1, 2015 | - | $99,867 | 344 | $290 | $99,867 | 1 | ||
| Jul 2, 2015 | - | $88,924 | -11% | 344 | $259 | $188,791 | 2 | |
| Jul 3, 2015 | - | $179,063 | +101% | 344 | $521 | $367,854 | 3 | |
| Jul 4, 2015 | - | $145,000 | -19% | 344 | $422 | $512,854 | 4 | |
| Jul 5, 2015 | - | $114,186 | -21% | 344 | $332 | $627,040 | 5 | |
| Jul 6, 2015 | - | $43,652 | -62% | 344 | $127 | $670,692 | 6 | |
| Jul 7, 2015 | - | $61,405 | +41% | 344 | $179 | $732,097 | 7 | |
| Jul 8, 2015 | - | $42,270 | -31% | -58% | 344 | $123 | $774,367 | 8 |
| Jul 9, 2015 | - | $35,601 | -16% | -60% | 344 | $103 | $799,968 | 9 |
| Jul 10, 2015 | - | $24,245 | -32% | -86% | 154 | $157 | $824,213 | 10 |
| Jul 11, 2015 | - | $34,225 | +41% | -76% | 154 | $222 | $858,438 | 11 |
| Jul 12, 2015 | - | $23,718 | -31% | -79% | 154 | $154 | $882,156 | 12 |
| Jul 13, 2015 | - | $9,833 | -59% | -77% | 138 | $71 | $891,989 | 13 |
| Jul 14, 2015 | - | $13,090 | +33% | -79% | 138 | $95 | $905,079 | 14 |
| Jul 15, 2015 | - | $10,952 | -16% | -74% | 138 | $79 | $916,031 | 15 |
| Jul 16, 2015 | - | $9,763 | -11% | -73% | 138 | $71 | $925,794 | 16 |
| Jul 17, 2015 | - | $7,837 | -20% | -68% | 52 | $151 | $933,631 | 17 |
| Jul 18, 2015 | - | $11,119 | +42% | -68% | 52 | $214 | $944,750 | 18 |
| Jul 19, 2015 | - | $8,761 | -21% | -63% | 52 | $168 | $953,511 | 19 |
| Jul 20, 2015 | - | $3,400 | -61% | -65% | 52 | $65 | $956,911 | 20 |
| Jul 21, 2015 | - | $4,638 | +36% | -65% | 52 | $89 | $961,549 | 21 |
| Jul 22, 2015 | - | $4,651 | n/c | -58% | 52 | $89 | $966,200 | 22 |
| Jul 23, 2015 | - | $4,050 | -13% | -59% | 52 | $78 | $970,250 | 23 |
| Jul 24, 2015 | - | $1,549 | -62% | -80% | 17 | $91 | $971,799 | 24 |
| Jul 25, 2015 | - | $1,947 | +26% | -82% | 17 | $115 | $973,746 | 25 |
| Jul 26, 2015 | - | $1,661 | -15% | -81% | 17 | $98 | $975,407 | 26 |
| Jul 27, 2015 | - | $629 | -62% | -82% | 17 | $37 | $976,036 | 27 |
| Jul 28, 2015 | - | $821 | +31% | -82% | 17 | $48 | $976,857 | 28 |
| Jul 29, 2015 | - | $1,093 | +33% | -76% | 17 | $64 | $977,950 | 29 |
| Jul 30, 2015 | - | $1,008 | -8% | -75% | 17 | $59 | $978,958 | 30 |
| Jul 31, 2015 | - | $722 | -28% | -53% | 6 | $120 | $979,680 | 31 |
| Aug 1, 2015 | - | $1,247 | +73% | -36% | 6 | $208 | $980,927 | 32 |
| Aug 2, 2015 | - | $1,055 | -15% | -36% | 6 | $176 | $981,982 | 33 |
Weekly Box Office Performance
| Date | Rank | Gross | % Change | Theaters | Per Theater | Total Gross | Week |
|---|---|---|---|---|---|---|---|
| Jun 26, 2015 | 32 | $188,791 | 344 | $549 | $188,791 | 1 | |
| Jul 3, 2015 | 18 | $611,114 | +224% | 344 | $1,776 | $799,905 | 2 |
| Jul 10, 2015 | 32 | $125,970 | -79% | 138 | $913 | $925,875 | 3 |
| Jul 17, 2015 | 51 | $44,375 | -65% | 52 | $853 | $970,250 | 4 |
| Jul 24, 2015 | 76 | $8,708 | -80% | 17 | $512 | $978,958 | 5 |
| Jul 31, 2015 | 77 | $5,563 | -36% | 6 | $927 | $984,521 | 6 |
| Aug 7, 2015 | 87 | $3,029 | -46% | 6 | $505 | $987,550 | 7 |
| Aug 14, 2015 | 68 | $13,932 | +360% | 3 | $4,644 | $1,001,482 | 8 |
| Aug 28, 2015 | 103 | $1,039 | 3 | $346 | $1,004,105 | 10 |
Leading
| Stephen Baldwin | Sgt. Mansfield | |
| Kevin Downes | John Paul | |
| David A.R. White | Wayne |
Supporting
| Rebecca St. James | Annie |
Cameo
| Si Robertson | Himself |
Supporting
| Candace Cameron Bure | Cynthia | |
| Scott Whyte | Eddie Adams | |
| Sean McGowan | Stephen George | |
| Ryan Doom | Pvt. Shears | |
| Sean Sedgwick | Pvt. Burgess |
Production and Technical Credits
| Carey Scott | Director | |
| Carey Scott | Screenwriter | |
| Harold Uhl | Screenwriter | |
| Kevin Downes | Screenwriter | |
| David A.R. White | Screenwriter | |
| Kevin Downes | Producer | |
| Bobby Downes | Producer | |
| David A.R. White | Producer | |
| Michael Scott | Producer | |
| Shelene Bryan | Producer | |
| Carey Scott | Story Creator | |
| Christopher Morrow | Executive Producer | |
| Bill Herren | Executive Producer | |
| Kevin Maloney | Executive Producer | |
| Daryl Lefever | Co-Producer | |
| Tom Saab | Co-Producer | |
| Randall Gregg | Director of Photography | |
| Mona Nahm | Production Designer | |
| Alex Kendrick | Editor | |
| David De Vos | Editor | |
| Steffan Fantini | Composer | |
| Marc Fantini | Composer | |
| Beverly Holloway | Casting Director |
Cast and crew with above-the-line roles are marked in bold. The line marks the division between above-the-line and below-the-line roles.
Full financial estimates for this film, including domestic and international box office, video sales, video rentals, TV and ancillary revenue are available through our research services. For more information, please contact us at research@the-numbers.com.