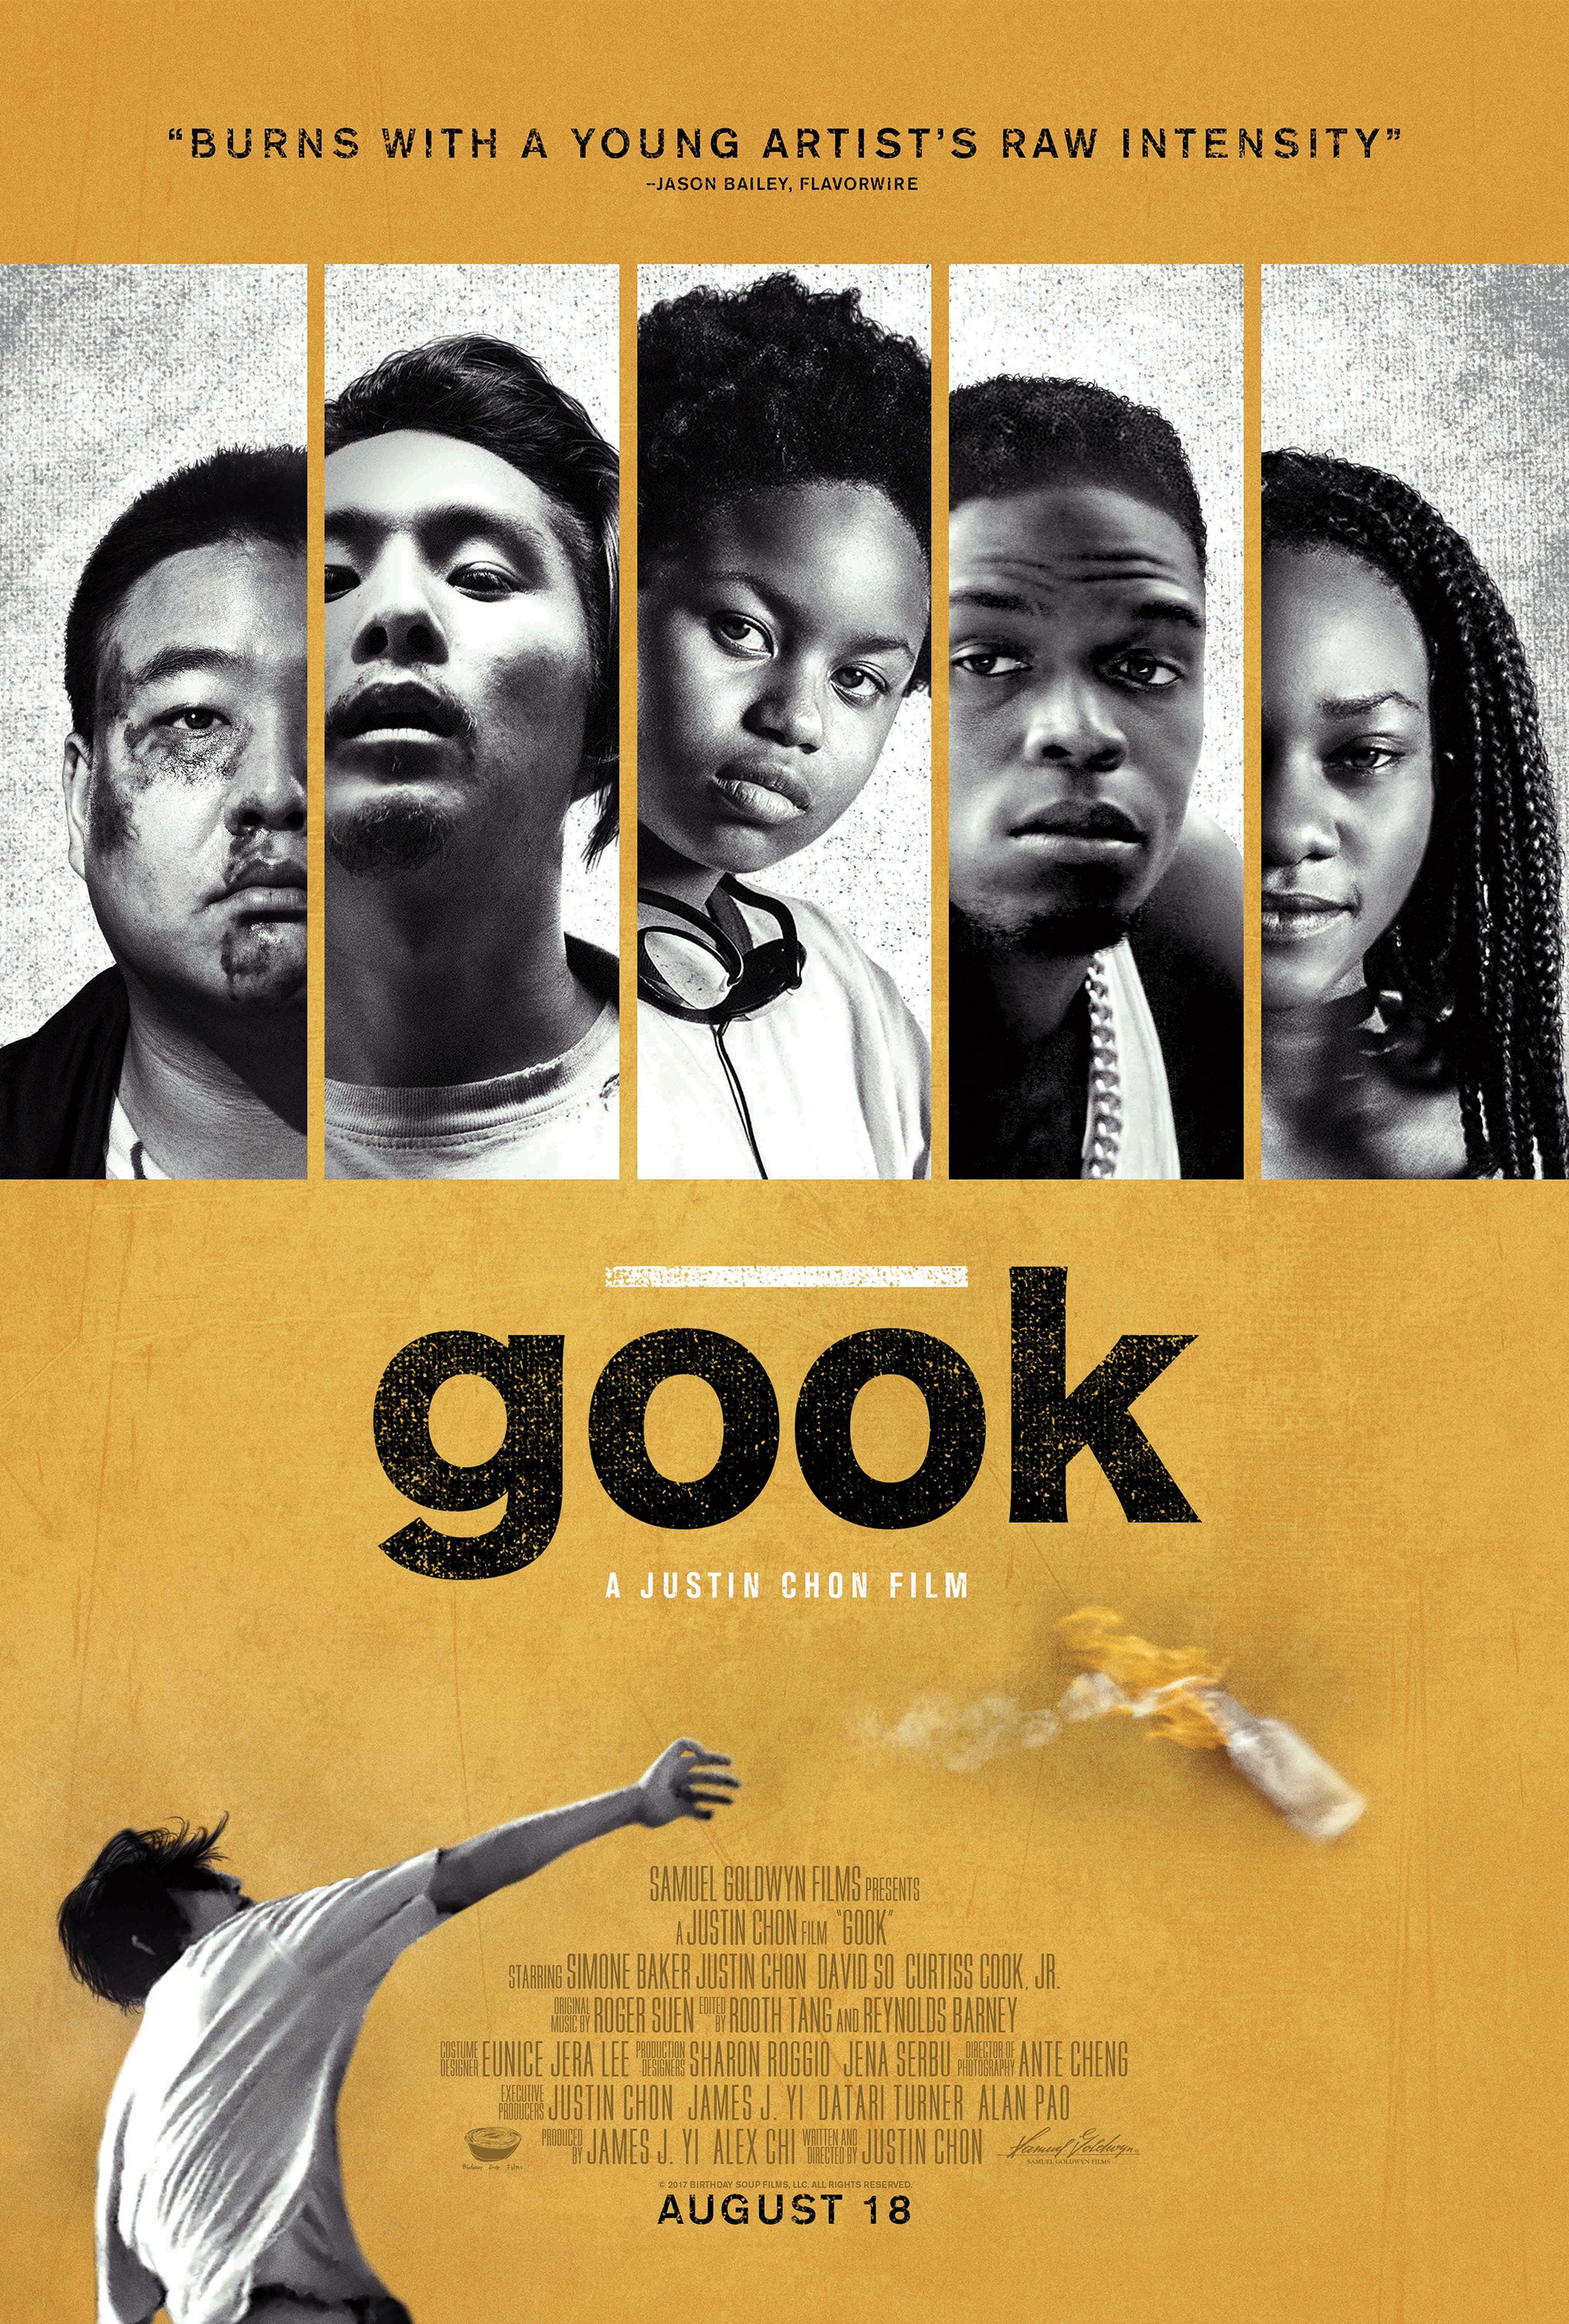
Gook (2017)
| Theatrical Performance | ||
| Domestic Box Office | $250,130 | Details |
| International Box Office | $1,409 | |
| Worldwide Box Office | $251,539 | |
| Domestic Physical Disc Sales | ||
| Blu-ray Sales (estimated) | $39,140 | |
| Total | $39,140 | |
| OpusData ID: 287880100 More info... | ||
| Further financial details... | ||
Synopsis
Eli and Daniel are two Korean American brothers that run their late father’s shoe store in a predominantly African American community of Los Angeles. These two brothers strike up a unique and unlikely friendship with an 11-year-old African American girl, Kamilla. As Daniel dreams of becoming a recording artist and Eli struggles to keep the store afloat, racial tensions build to a breaking point in L.A. as the “infamous” L.A. Riots break out.
Metrics
| Opening Weekend: | $27,044 (10.8% of total gross) |
| Legs: | 3.52 (domestic box office/biggest weekend) |
| Domestic Share: | 99.4% (domestic box office/worldwide) |
| Theater counts: | 2 opening theaters/46 max. theaters, 1.6 weeks average run per theater |
| Infl. Adj. Dom. BO | $333,505 |
Movie Details
| Domestic Releases: | August 18th, 2017 (Limited) by Samuel Goldwyn Films |
| International Releases: | March 16th, 2018 (Limited) (United Kingdom) |
| Video Release: | December 5th, 2017 by Sony Pictures Home Entertainment |
| MPA Rating: | Not Rated |
| Running Time: | 94 minutes |
| Geographical setting: | Los Angeles |
| Plot point: | African Americans, Coming of Age, Race Relations, Riots |
| Target audience: | Asian-Americans |
| Time period setting: | 1990s |
| Source: | Original Screenplay |
| Genre: | Drama |
| Production Method: | Live Action |
| Creative Type: | Historical Fiction |
| Production/Financing Companies: | Birthday Soup Films, Samuel Goldwyn Films |
| Production Countries: | United States |
| Languages: | English, Korean |
Weekend Box Office Performance
| Date | Rank | Gross | % Change | Theaters | Per Theater | Total Gross | Week |
|---|---|---|---|---|---|---|---|
| Aug 18, 2017 | 52 | $27,044 | 2 | $13,522 | $27,044 | 1 | |
| Aug 25, 2017 | 42 | $71,111 | +163% | 24 | $2,963 | $105,145 | 2 |
| Sep 1, 2017 | 54 | $43,678 | -39% | 27 | $1,618 | $178,036 | 3 |
| Sep 8, 2017 | 57 | $19,354 | -56% | 20 | $968 | $222,191 | 4 |
Weekly Box Office Performance
| Date | Rank | Gross | % Change | Theaters | Per Theater | Total Gross | Week |
|---|---|---|---|---|---|---|---|
| Aug 18, 2017 | 53 | $34,034 | 2 | $17,017 | $34,034 | 1 | |
| Aug 25, 2017 | 42 | $100,324 | +195% | 46 | $2,181 | $134,358 | 2 |
| Sep 1, 2017 | 53 | $68,479 | -32% | 27 | $2,536 | $202,837 | 3 |
| Sep 8, 2017 | 56 | $26,649 | -61% | 20 | $1,332 | $229,486 | 4 |
| Sep 15, 2017 | 72 | $13,380 | -50% | 16 | $836 | $242,866 | 5 |
| Sep 22, 2017 | 94 | $3,491 | -74% | 7 | $499 | $246,357 | 6 |
| Sep 29, 2017 | 97 | $1,987 | -43% | 4 | $497 | $248,344 | 7 |
| Oct 6, 2017 | 104 | $1,786 | -10% | 4 | $447 | $250,130 | 8 |
Full financial estimates for this film, including domestic and international box office, video sales, video rentals, TV and ancillary revenue are available through our research services. For more information, please contact us at research@the-numbers.com.