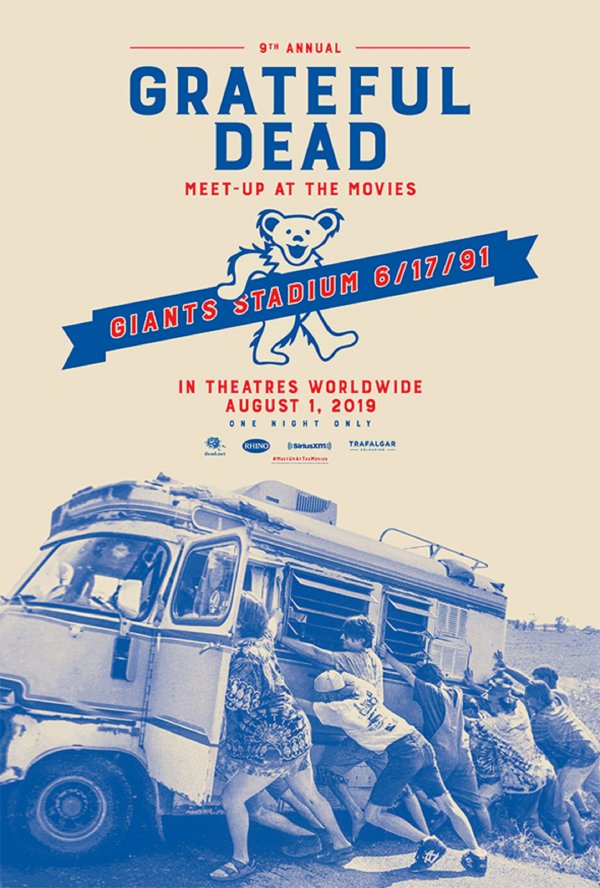
Grateful Dead Meet-Up at the Movies 2019 (2019)
| Theatrical Performance | ||
| Domestic Box Office | $534,611 | Details |
| OpusData ID: 414600100 More info... | ||
| Further financial details... | ||
Metrics
| Opening Weekend: | $3,786 (0.7% of total gross) |
| Legs: | 39.17 (domestic box office/biggest weekend) |
| Domestic Share: | 100.0% (domestic box office/worldwide) |
| Theater counts: | 4 opening theaters/4 max. theaters, 2.3 weeks average run per theater |
| Infl. Adj. Dom. BO | $698,033 |
Movie Details
| Domestic Releases: | August 1st, 2019 (Special Engagement) by Trafalgar Releasing |
| MPA Rating: | Not Rated |
| Running Time: | 120 minutes |
| Source: | Based on Real Life Events |
| Genre: | Documentary |
| Production Method: | Live Action |
| Creative Type: | Factual |
| Languages: | English |
Weekend Box Office Performance
| Date | Rank | Gross | % Change | Theaters | Per Theater | Total Gross | Week |
|---|---|---|---|---|---|---|---|
| Aug 2, 2019 | 59 | $3,786 | 4 | $947 | $495,122 | 1 | |
| Aug 9, 2019 | 82 | $58 | -98% | 1 | $58 | $511,376 | 2 |
| Aug 16, 2019 | 79 | $550 | +848% | 2 | $275 | $520,663 | 3 |
| Aug 23, 2019 | 56 | $13,648 | +2,381% | 2 | $6,824 | $534,611 | 4 |
Weekly Box Office Performance
| Date | Rank | Gross | % Change | Theaters | Per Theater | Total Gross | Week |
|---|---|---|---|---|---|---|---|
| Aug 2, 2019 | 47 | $19,982 | 2 | $9,991 | $511,318 | 2 | |
| Aug 9, 2019 | 60 | $8,795 | -56% | 1 | $8,795 | $520,113 | 3 |
| Aug 16, 2019 | 84 | $850 | -90% | 2 | $425 | $520,963 | 4 |
Full financial estimates for this film, including domestic and international box office, video sales, video rentals, TV and ancillary revenue are available through our research services. For more information, please contact us at research@the-numbers.com.