Growing up Smith (2017)
| Theatrical Performance | ||
| Domestic Box Office | $35,312 | Details |
| Further financial details... | ||
Synopsis
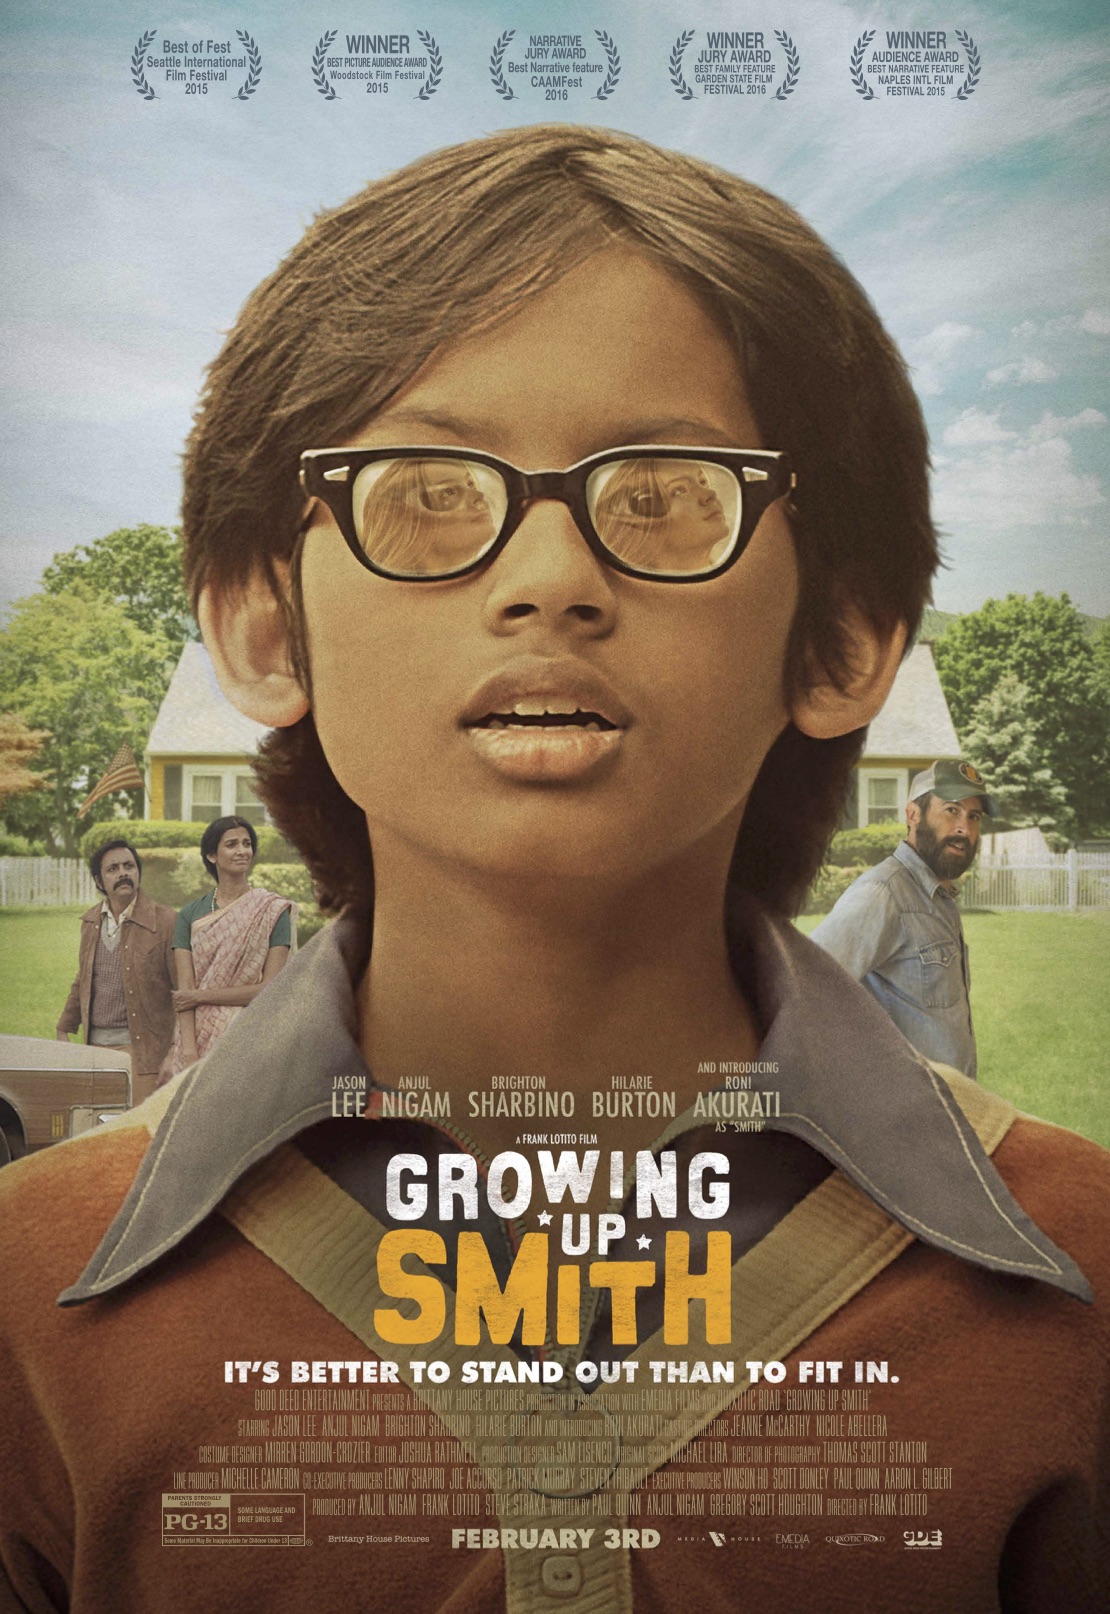
An irrepressibly likeable 10-year-old boy from India may possibly lose it all—including the love of his life—when his obsession for living the American Dream unexpectedly takes a wrong turn.
Metrics
| Opening Weekend: | $14,867 (42.1% of total gross) |
| Legs: | 2.38 (domestic box office/biggest weekend) |
| Domestic Share: | 100.0% (domestic box office/worldwide) |
| Production Budget: | $2,000,000 (worldwide box office is 0.0 times production budget) |
| Theater counts: | 5 opening theaters/12 max. theaters, 1.4 weeks average run per theater |
| Infl. Adj. Dom. BO | $47,087 |
Movie Details
| Domestic Releases: | February 3rd, 2017 (Limited) by Good Deed Entertainment |
| Video Release: | May 2nd, 2017 by Cinedigm |
| MPA Rating: | PG-13 for some language and brief drug use. (Rating bulletin 2425 (Cert #50460), 5/18/2016) |
| Running Time: | 102 minutes |
| Plot point: | Coming of Age, Culture Clash, First Love, Generational Conflict, Immigration, Interracial Romance, Romance |
| Time period setting: | 1970s |
| Source: | Original Screenplay |
| Genre: | Comedy |
| Production Method: | Live Action |
| Creative Type: | Historical Fiction |
| Production/Financing Companies: | Good Deed Entertainment, Brittany House Pictures, EMedia Films , Quixotic Road |
| Production Countries: | United States |
| Languages: | English |
Weekend Box Office Performance
| Date | Rank | Gross | % Change | Theaters | Per Theater | Total Gross | Week |
|---|---|---|---|---|---|---|---|
| Feb 3, 2017 | 49 | $14,867 | 5 | $2,973 | $14,867 | 1 | |
| Feb 10, 2017 | 59 | $11,621 | -22% | 12 | $968 | $26,488 | 2 |
Daily Box Office Performance
| Date | Rank | Gross | %YD | %LW | Theaters | Per Theater | Total Gross | Days |
|---|---|---|---|---|---|---|---|---|
| Feb 3, 2017 | - | $4,693 | 5 | $939 | $4,693 | 1 | ||
| Feb 4, 2017 | - | $7,793 | +66% | 5 | $1,559 | $12,486 | 2 | |
| Feb 5, 2017 | - | $2,381 | -69% | 5 | $476 | $14,867 | 3 | |
| Feb 10, 2017 | - | $2,811 | -40% | 12 | $234 | $17,678 | 8 | |
| Feb 11, 2017 | - | $6,425 | +129% | -18% | 12 | $535 | $24,103 | 9 |
| Feb 12, 2017 | - | $2,385 | -63% | n/c | 12 | $199 | $26,488 | 10 |
| Feb 13, 2017 | - | $960 | -60% | 12 | $80 | $27,448 | 11 | |
| Feb 14, 2017 | - | $1,278 | +33% | 12 | $107 | $28,726 | 12 | |
| Feb 15, 2017 | - | $1,470 | +15% | 12 | $123 | $30,196 | 13 | |
| Feb 16, 2017 | - | $389 | -74% | 12 | $32 | $35,312 | 14 |
Weekly Box Office Performance
| Date | Rank | Gross | % Change | Theaters | Per Theater | Total Gross | Week |
|---|---|---|---|---|---|---|---|
| Feb 10, 2017 | 56 | $15,718 | 12 | $1,310 | $35,312 | 2 |
Full financial estimates for this film, including domestic and international box office, video sales, video rentals, TV and ancillary revenue are available through our research services. For more information, please contact us at research@the-numbers.com.
Synopsis
An irrepressibly likeable 10-year-old boy from India may possibly lose it all—including the love of his life—when his obsession for living the American Dream unexpectedly takes a wrong turn.
Metrics
| Opening Weekend: | $14,867 (42.1% of total gross) |
| Legs: | 2.38 (domestic box office/biggest weekend) |
| Domestic Share: | 100.0% (domestic box office/worldwide) |
| Production Budget: | $2,000,000 (worldwide box office is 0.0 times production budget) |
| Theater counts: | 5 opening theaters/12 max. theaters, 1.4 weeks average run per theater |
| Infl. Adj. Dom. BO | $47,087 |
Movie Details
| Domestic Releases: | February 3rd, 2017 (Limited) by Good Deed Entertainment |
| Video Release: | May 2nd, 2017 by Cinedigm |
| MPA Rating: | PG-13 for some language and brief drug use. (Rating bulletin 2425 (Cert #50460), 5/18/2016) |
| Running Time: | 102 minutes |
| Plot point: | Coming of Age, Culture Clash, First Love, Generational Conflict, Immigration, Interracial Romance, Romance |
| Time period setting: | 1970s |
| Source: | Original Screenplay |
| Genre: | Comedy |
| Production Method: | Live Action |
| Creative Type: | Historical Fiction |
| Production/Financing Companies: | Good Deed Entertainment, Brittany House Pictures, EMedia Films , Quixotic Road |
| Production Countries: | United States |
| Languages: | English |
Weekend Box Office Performance
| Date | Rank | Gross | % Change | Theaters | Per Theater | Total Gross | Week |
|---|---|---|---|---|---|---|---|
| Feb 3, 2017 | 49 | $14,867 | 5 | $2,973 | $14,867 | 1 | |
| Feb 10, 2017 | 59 | $11,621 | -22% | 12 | $968 | $26,488 | 2 |
Daily Box Office Performance
| Date | Rank | Gross | %YD | %LW | Theaters | Per Theater | Total Gross | Days |
|---|---|---|---|---|---|---|---|---|
| Feb 3, 2017 | - | $4,693 | 5 | $939 | $4,693 | 1 | ||
| Feb 4, 2017 | - | $7,793 | +66% | 5 | $1,559 | $12,486 | 2 | |
| Feb 5, 2017 | - | $2,381 | -69% | 5 | $476 | $14,867 | 3 | |
| Feb 10, 2017 | - | $2,811 | -40% | 12 | $234 | $17,678 | 8 | |
| Feb 11, 2017 | - | $6,425 | +129% | -18% | 12 | $535 | $24,103 | 9 |
| Feb 12, 2017 | - | $2,385 | -63% | n/c | 12 | $199 | $26,488 | 10 |
| Feb 13, 2017 | - | $960 | -60% | 12 | $80 | $27,448 | 11 | |
| Feb 14, 2017 | - | $1,278 | +33% | 12 | $107 | $28,726 | 12 | |
| Feb 15, 2017 | - | $1,470 | +15% | 12 | $123 | $30,196 | 13 | |
| Feb 16, 2017 | - | $389 | -74% | 12 | $32 | $35,312 | 14 |
Weekly Box Office Performance
| Date | Rank | Gross | % Change | Theaters | Per Theater | Total Gross | Week |
|---|---|---|---|---|---|---|---|
| Feb 10, 2017 | 56 | $15,718 | 12 | $1,310 | $35,312 | 2 |
Full financial estimates for this film, including domestic and international box office, video sales, video rentals, TV and ancillary revenue are available through our research services. For more information, please contact us at research@the-numbers.com.