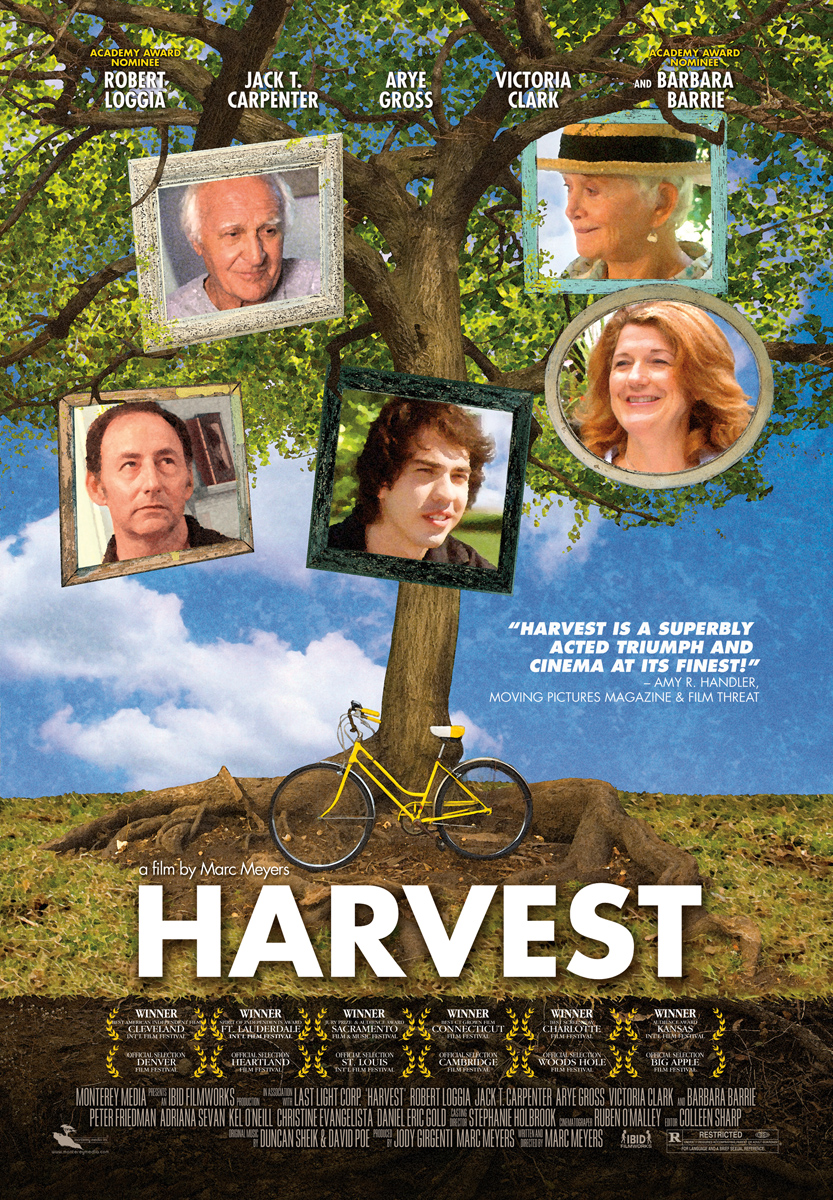
Harvest (2011)
| Theatrical Performance | ||
| Domestic Box Office | $24,657 | Details |
| OpusData ID: 152520100 More info... | ||
| Further financial details... | ||
Synopsis
Three generations of a family come together one summer, around the eventual passing of the patriarch of the family, a WWII veteran. Gathered at the family home and in and around their beautiful shoreline town, years of resentment and betrayal within the family surface, and the grandson, a college student, does his part to hold them all together, growing up in the process.
Metrics
| Opening Weekend: | $5,870 (23.8% of total gross) |
| Legs: | 4.20 (domestic box office/biggest weekend) |
| Domestic Share: | 100.0% (domestic box office/worldwide) |
| Theater counts: | 1 opening theaters/4 max. theaters, 1.8 weeks average run per theater |
| Infl. Adj. Dom. BO | $37,184 |
Movie Details
| Domestic Releases: | May 6th, 2011 (Limited) by Monterey Media |
| MPA Rating: | R for language and a brief sexual reference. (Rating bulletin 2150, 12/8/2010) |
| Running Time: | 103 minutes |
| Cast, crew, or production detail: | Ensemble |
| Plot point: | Coming of Age, Delayed Adulthood, Dysfunctional Family, Faulty Memory, Immigration, Romance, Terminal Illness, You Can't Go Home Again |
| Source: | Original Screenplay |
| Genre: | Drama |
| Production Method: | Live Action |
| Creative Type: | Contemporary Fiction |
| Production/Financing Companies: | Ibid Filmworks |
| Production Countries: | United States |
| Languages: | English |
Weekend Box Office Performance
| Date | Rank | Gross | % Change | Theaters | Per Theater | Total Gross | Week |
|---|---|---|---|---|---|---|---|
| May 6, 2011 | 86 | $5,870 | 1 | $5,870 | $15,578 | 1 | |
| May 13, 2011 | 125 | $130 | -98% | 1 | $130 | $18,198 | 2 |
| May 27, 2011 | 83 | $2,651 | 4 | $663 | $21,147 | 4 | |
| Jun 3, 2011 | 108 | $529 | -80% | 1 | $529 | $24,073 | 5 |
Daily Box Office Performance
| Date | Rank | Gross | %YD | %LW | Theaters | Per Theater | Total Gross | Days |
|---|---|---|---|---|---|---|---|---|
| May 30, 2011 | 70 | $987 | 4 | $247 | $22,134 | 25 |
Weekly Box Office Performance
| Date | Rank | Gross | % Change | Theaters | Per Theater | Total Gross | Week |
|---|---|---|---|---|---|---|---|
| May 6, 2011 | 88 | $8,360 | 1 | $8,360 | $18,068 | 1 | |
| May 13, 2011 | 130 | $130 | -98% | 1 | $130 | $18,198 | 2 |
| May 27, 2011 | 81 | $5,048 | 4 | $1,262 | $23,544 | 4 | |
| Jun 3, 2011 | 106 | $1,113 | -78% | 2 | $557 | $24,657 | 5 |
Full financial estimates for this film, including domestic and international box office, video sales, video rentals, TV and ancillary revenue are available through our research services. For more information, please contact us at research@the-numbers.com.