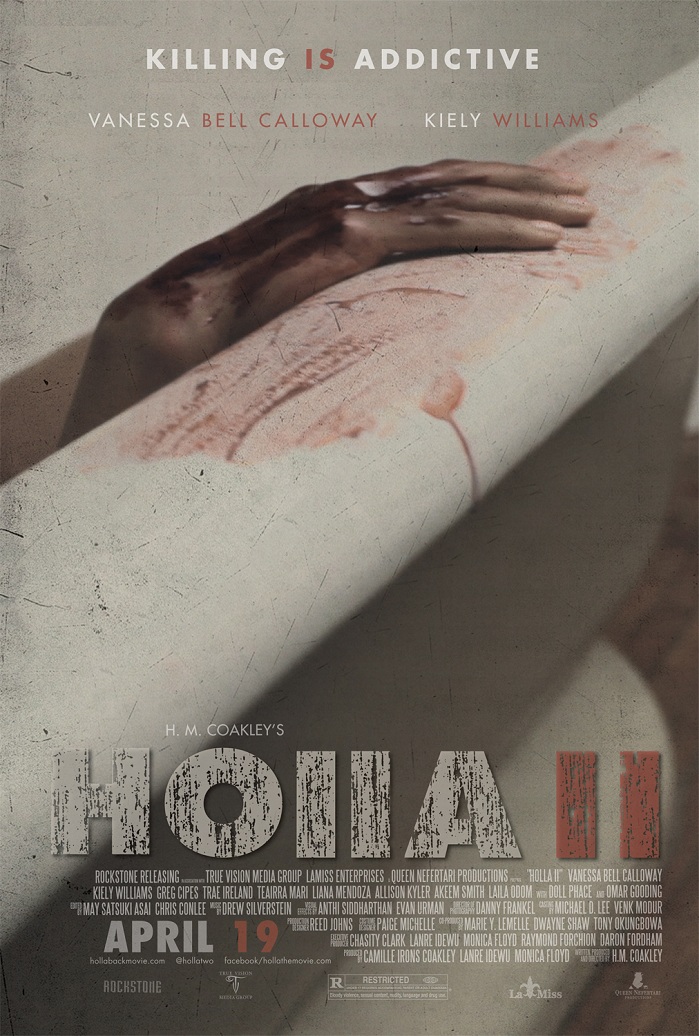
Holla II (2013)
| Theatrical Performance | ||
| Domestic Box Office | $41,537 | Details |
| OpusData ID: 189260100 More info... | ||
| Further financial details... | ||
Synopsis
After narrowly escaping with her life at the hands of her mentally ill sister Veronica, Monica, with the help of her Mother, Marion, has taken great measures to ensure her safety, including changing her face and relocating to the South. Six years has past and now she finally believes she is safe from Veronica. Little does she know that death and betrayal still await her and her friends on the eve of her wedding at a southern plantation house rumored to be haunted by 13 murdered slaves. This time no one is safe and everyone is a suspect as killing becomes addictive.
Metrics
| Opening Weekend: | $37,444 (90.1% of total gross) |
| Legs: | 1.11 (domestic box office/biggest weekend) |
| Domestic Share: | 100.0% (domestic box office/worldwide) |
| Theater counts: | 6 opening theaters/6 max. theaters, 1.0 weeks average run per theater |
| Infl. Adj. Dom. BO | $61,104 |
Movie Details
| Domestic Releases: | April 19th, 2013 (Limited) by Rockstone Releasing |
| MPA Rating: | R for bloody violence, sexual content, nudity, language and drug use. (Rating bulletin 2264, 3/20/2013) |
| Running Time: | 90 minutes |
| Franchise: | Holla |
| Cast, crew, or production detail: | Legacy Sequel |
| Plot point: | African Americans, Haunting, Sibling Rivalry, Twins |
| Social setting: | Slavery |
| Subgenre: | Slasher Horror |
| Source: | Original Screenplay |
| Genre: | Horror |
| Production Method: | Live Action |
| Creative Type: | Contemporary Fiction |
| Production/Financing Companies: | Queen Nefertari Productions, Lamiss Enterprises, True Vision Media Group |
| Production Countries: | United States |
| Languages: | English |
Weekend Box Office Performance
| Date | Rank | Gross | % Change | Theaters | Per Theater | Total Gross | Week |
|---|---|---|---|---|---|---|---|
| Apr 19, 2013 | 50 | $37,444 | 6 | $6,241 | $37,444 | 1 |
Weekly Box Office Performance
| Date | Rank | Gross | % Change | Theaters | Per Theater | Total Gross | Week |
|---|---|---|---|---|---|---|---|
| Apr 19, 2013 | 53 | $41,537 | 6 | $6,923 | $41,537 | 1 |
Full financial estimates for this film, including domestic and international box office, video sales, video rentals, TV and ancillary revenue are available through our research services. For more information, please contact us at research@the-numbers.com.