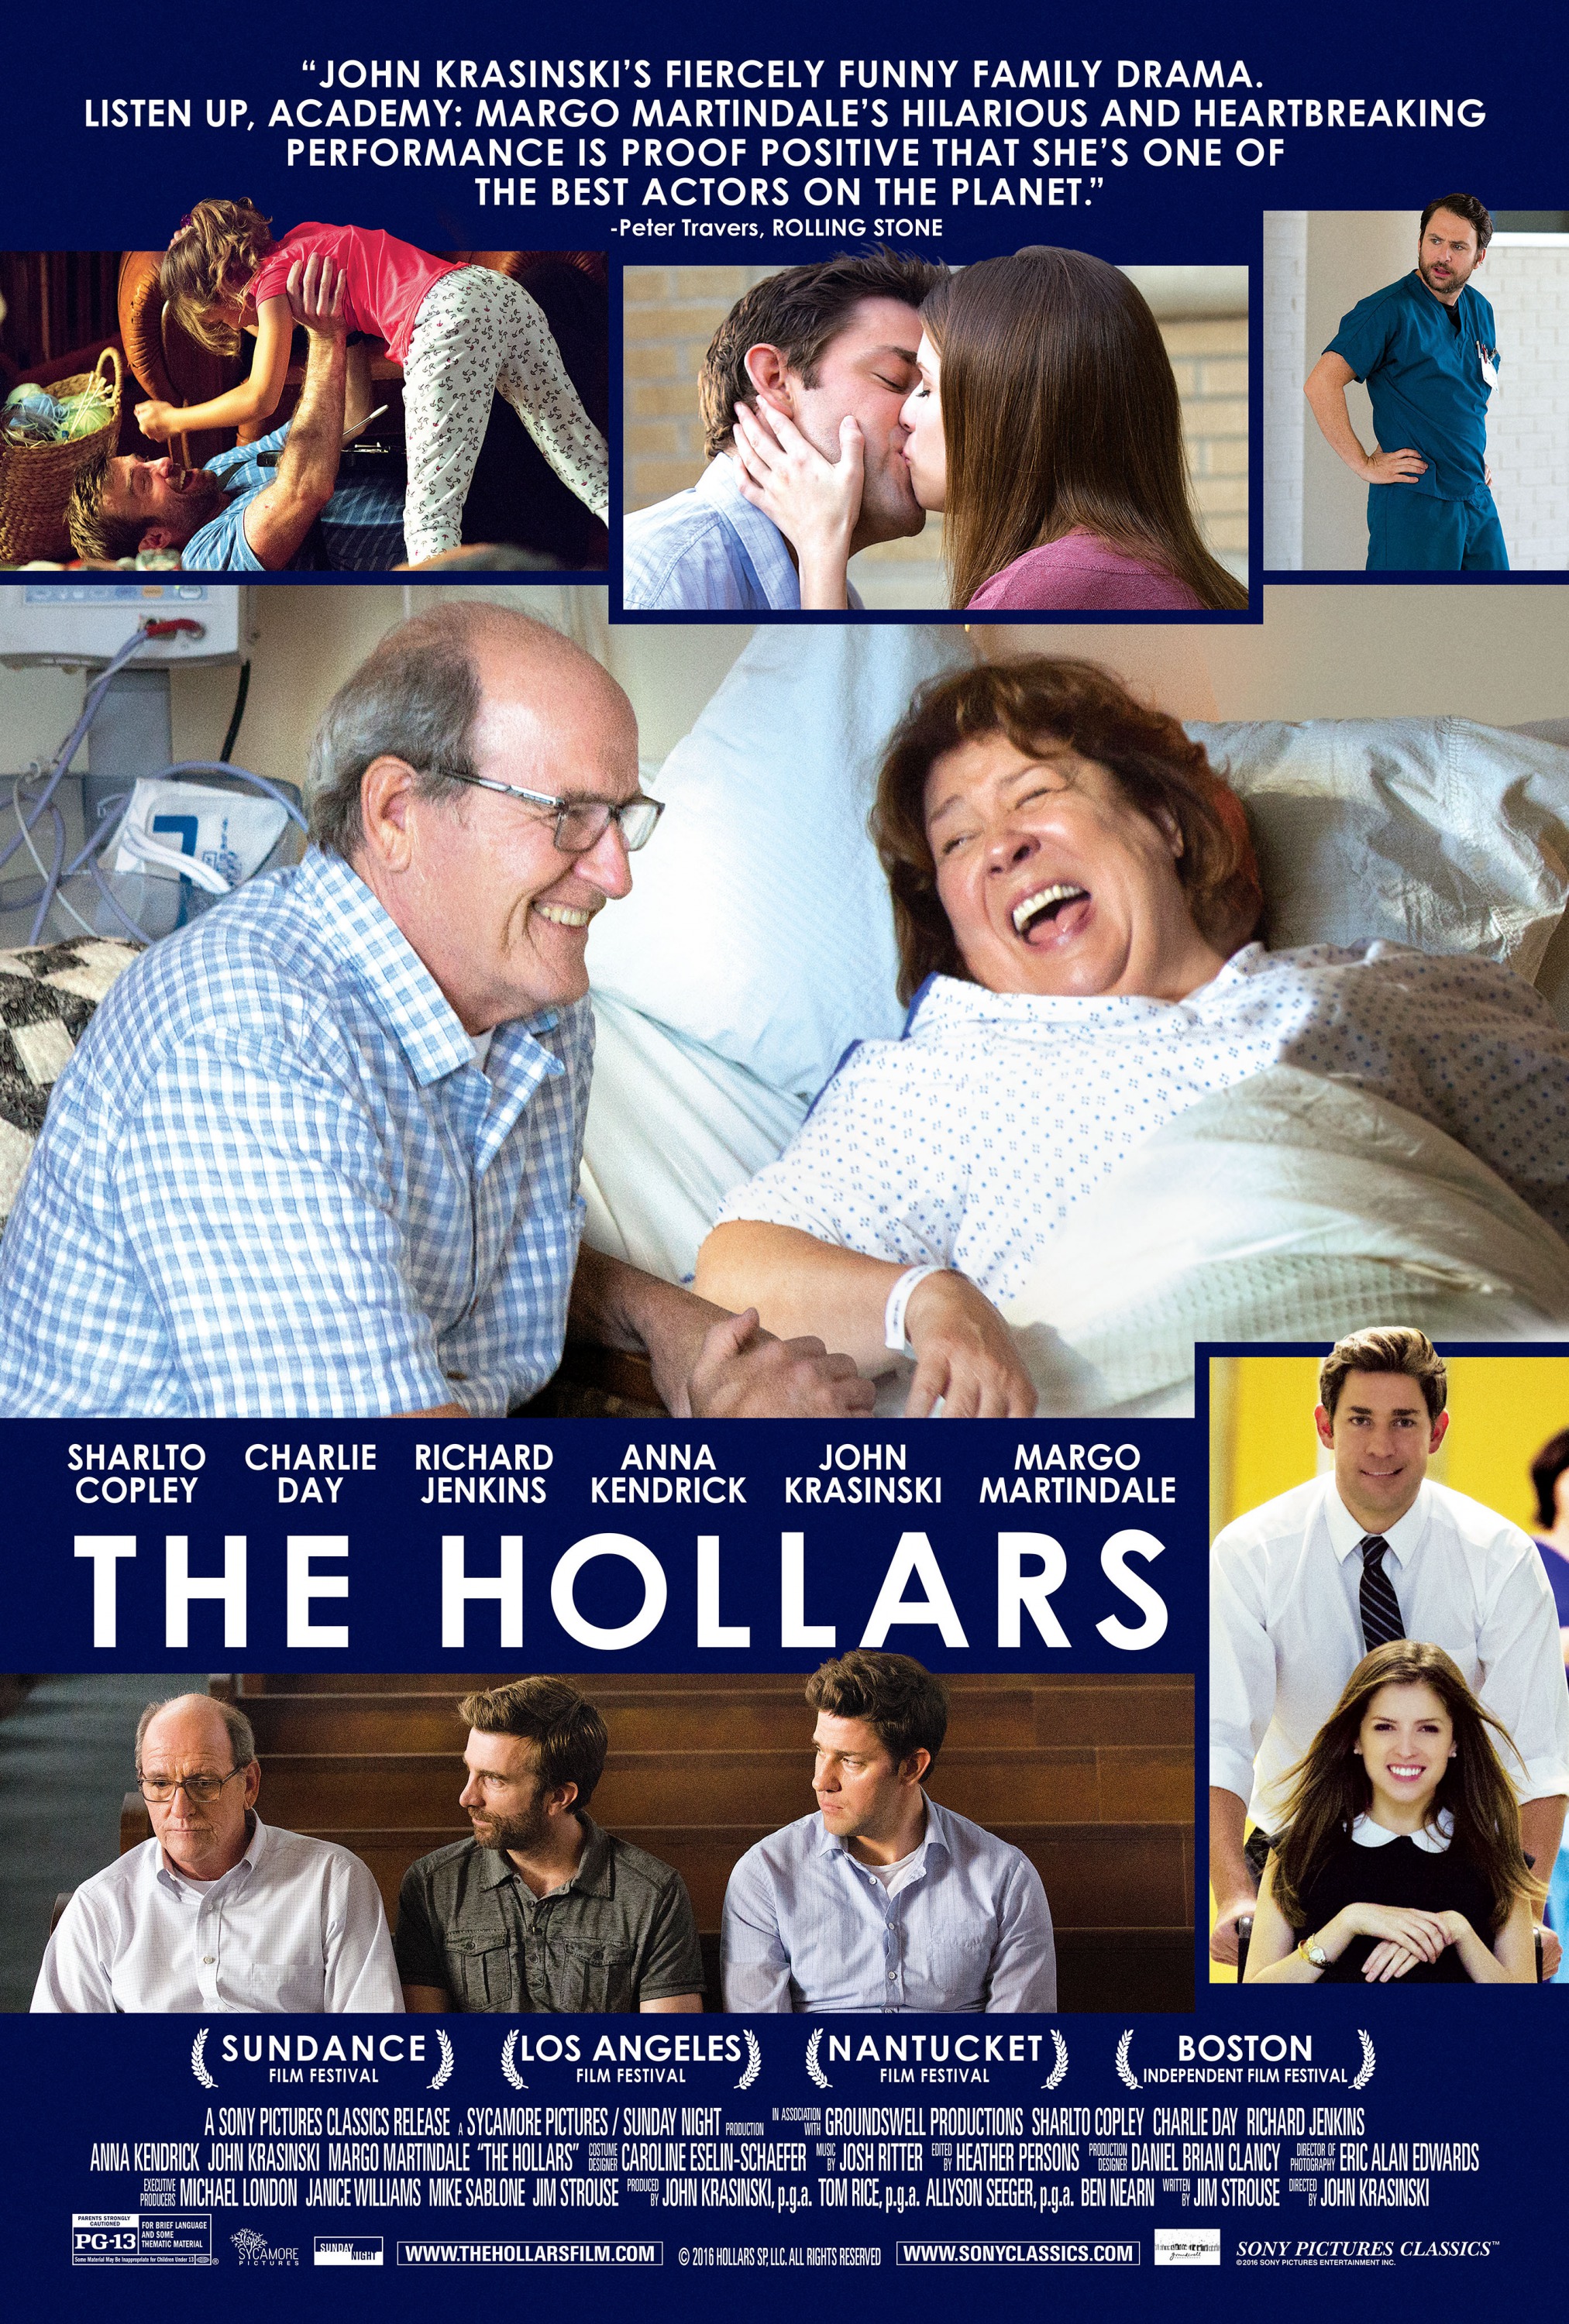
The Hollars (2016)
| Theatrical Performance | ||
| Domestic Box Office | $1,016,985 | Details |
| International Box Office | $122,517 | Details |
| Worldwide Box Office | $1,139,502 | |
| Domestic Physical Disc Sales | ||
| DVD Sales (estimated) | $136,550 | |
| Blu-ray Sales (estimated) | $107,723 | |
| Total | $244,273 | |
| OpusData ID: 236080100 More info... | ||
| Further financial details... | ||
Synopsis
John Hollar, a struggling NYC artist is forced to navigate the small middle-American town he left behind when news of his mother's illness brings him home. Back in the house he grew up in, John is immediately swept up in the problems of his dysfunctional family, high-school rival and an over-eager ex-girlfriend as he faces impending fatherhood with his girlfriend in New York.
Metrics
| Opening Weekend: | $38,210 (3.8% of total gross) |
| Legs: | 4.06 (domestic box office/biggest weekend) |
| Domestic Share: | 89.2% (domestic box office/worldwide) |
| Theater counts: | 4 opening theaters/298 max. theaters, 2.7 weeks average run per theater |
| Infl. Adj. Dom. BO | $1,406,149 |
Movie Details
| Domestic Releases: | August 26th, 2016 (Limited) by Sony Pictures Classics |
| International Releases: | November 11th, 2016 (Wide) (Sweden)
January 12th, 2017 (Wide) (Germany) March 3rd, 2017 (Wide) (South Africa) March 17th, 2017 (Wide) (Spain) ... Show all releases |
| Video Release: | December 6th, 2016 by Sony Pictures Home Entertainment |
| MPA Rating: | PG-13 for brief language and some thematic material. (Rating bulletin 2380, 7/1/2015) |
| Running Time: | 88 minutes |
| Cast, crew, or production detail: | Voiceover/Narration |
| Plot point: | Doctors, Dysfunctional Family, Fired, Medical and Hospitals, Romance |
| Social setting: | Life in a Small Town |
| Source: | Original Screenplay |
| Genre: | Drama |
| Production Method: | Live Action |
| Creative Type: | Contemporary Fiction |
| Production/Financing Companies: | Sycamore Pictures, Sunday Night, Groundswell Productions |
| Production Countries: | United States |
| Languages: | English |
Weekend Box Office Performance
| Date | Rank | Gross | % Change | Theaters | Per Theater | Total Gross | Week |
|---|---|---|---|---|---|---|---|
| Aug 26, 2016 | 50 | $38,210 | 4 | $9,553 | $38,210 | 1 | |
| Sep 2, 2016 | 44 | $98,954 | +159% | 23 | $4,302 | $149,218 | 2 |
| Sep 9, 2016 | 41 | $63,123 | -36% | 32 | $1,973 | $262,376 | 3 |
| Sep 16, 2016 | 36 | $117,354 | +86% | 97 | $1,210 | $407,322 | 4 |
| Sep 23, 2016 | 26 | $250,340 | +113% | 298 | $840 | $706,484 | 5 |
| Sep 30, 2016 | 36 | $90,717 | -64% | 197 | $460 | $902,396 | 6 |
| Oct 7, 2016 | 57 | $17,840 | -80% | 40 | $446 | $963,831 | 7 |
| Oct 14, 2016 | 65 | $9,578 | -46% | 21 | $456 | $982,267 | 8 |
| Oct 21, 2016 | 74 | $11,284 | +18% | 45 | $251 | $996,783 | 9 |
| Oct 28, 2016 | 78 | $3,846 | -66% | 17 | $226 | $1,007,811 | 10 |
| Nov 4, 2016 | 112 | $540 | -86% | 2 | $270 | $1,010,638 | 11 |
| Nov 11, 2016 | 90 | $1,110 | +106% | 3 | $370 | $1,011,837 | 12 |
| Nov 18, 2016 | 78 | $1,825 | +64% | 8 | $228 | $1,014,002 | 13 |
| Nov 25, 2016 | 76 | $1,566 | -14% | 7 | $224 | $1,016,273 | 14 |
| Dec 2, 2016 | 120 | $143 | -91% | 1 | $143 | $1,016,872 | 15 |
| Dec 9, 2016 | 101 | $66 | -54% | 1 | $66 | $1,016,965 | 16 |
Weekly Box Office Performance
| Date | Rank | Gross | % Change | Theaters | Per Theater | Total Gross | Week |
|---|---|---|---|---|---|---|---|
| Aug 26, 2016 | 55 | $50,264 | 4 | $12,566 | $50,264 | 1 | |
| Sep 2, 2016 | 45 | $148,989 | +196% | 23 | $6,478 | $199,253 | 2 |
| Sep 9, 2016 | 42 | $90,715 | -39% | 32 | $2,835 | $289,968 | 3 |
| Sep 16, 2016 | 34 | $166,176 | +83% | 97 | $1,713 | $456,144 | 4 |
| Sep 23, 2016 | 26 | $355,535 | +114% | 298 | $1,193 | $811,679 | 5 |
| Sep 30, 2016 | 36 | $134,312 | -62% | 197 | $682 | $945,991 | 6 |
| Oct 7, 2016 | 60 | $26,698 | -80% | 40 | $667 | $972,689 | 7 |
| Oct 14, 2016 | 72 | $12,810 | -52% | 21 | $610 | $985,499 | 8 |
| Oct 21, 2016 | 71 | $18,466 | +44% | 45 | $410 | $1,003,965 | 9 |
| Oct 28, 2016 | 79 | $6,133 | -67% | 17 | $361 | $1,010,098 | 10 |
| Nov 4, 2016 | 113 | $629 | -90% | 2 | $315 | $1,010,727 | 11 |
| Nov 11, 2016 | 106 | $1,450 | +131% | 3 | $483 | $1,012,177 | 12 |
| Nov 18, 2016 | 89 | $2,530 | +74% | 8 | $316 | $1,014,707 | 13 |
| Nov 25, 2016 | 89 | $2,022 | -20% | 7 | $289 | $1,016,729 | 14 |
| Dec 2, 2016 | 129 | $170 | -92% | 1 | $170 | $1,016,899 | 15 |
| Dec 9, 2016 | 111 | $86 | -49% | 1 | $86 | $1,016,985 | 16 |
Top International Territories
Box Office Summary Per Territory
| Territory | Release Date |
Opening Weekend |
Opening Weekend Screens/Theaters |
Maximum Screens/Theaters |
Theatrical Engagements |
Total Box Office |
Report Date |
|||
|---|---|---|---|---|---|---|---|---|---|---|
| Germany | 1/12/2017 | $70,244 | 103 | 103 | 120 | $72,934 | 2/7/2017 | |||
| South Africa | 3/3/2017 | $0 | 0 | 7 | 8 | $11,274 | 3/27/2017 | |||
| Spain | 3/17/2017 | $15,916 | 21 | 23 | 49 | $37,749 | 4/7/2017 | |||
| Sweden | 11/11/2016 | $560 | 3 | 3 | 3 | $560 | 11/14/2016 | |||
| International Total | $122,517 | 4/7/2017 | ||||||||
Note: Territories vary in whether they report screens or theaters. Full details on international box office data are available via our OpusData service.
Lead Ensemble Member
| Sharlto Copley | Ron Hollar | |
| Charlie Day | Jason | |
| Richard Jenkins | Don Hollar | |
| Anna Kendrick | Rebecca | |
| John Krasinski | John Hollar | |
| Margo Martindale | Sally Hollar |
Supporting
| Randall Park | Dr. Fong | |
| Mary Elizabeth Winstead | Gwen | |
| Josh Groban | Reverend Dan | |
| Tonea Stewart | Latisha | |
| Isabela Costine | Constance | |
| Gus Sanchez | Pedro | |
| Brady Permenter | Brady | |
| Didi Costine | Matilda | |
| Mary Kay Place | Pam | |
| Ashley Dyke | Stacey |
Production and Technical Credits
| John Krasinski | Director | |
| Jim Strouse* | Screenwriter | |
| John Krasinski | Producer | |
| Tom Rice | Producer | |
| Allyson Seeger | Producer | |
| Ben Nearn | Producer | |
| Michael Landon* | Executive Producer | |
| Janice Williams | Executive Producer | |
| Mike Sablone | Executive Producer | |
| Jim Strouse* | Executive Producer | |
| Eric Alan Edwards | Director of Photography | |
| Daniel B. Clancy | Production Designer | |
| Heather Persons | Editor | |
| Josh Ritter | Composer | |
| Caroline Eselin-Schaffer | Costume Designer | |
| Toddy Burton | Co-Producer | |
| Kelly Cantley Kashima | Co-Producer | |
| Kelley Sims | Co-Producer | |
| Kirk Michael Fellows | Line Producer |
Cast and crew with above-the-line roles are marked in bold. The line marks the division between above-the-line and below-the-line roles.
Full financial estimates for this film, including domestic and international box office, video sales, video rentals, TV and ancillary revenue are available through our research services. For more information, please contact us at research@the-numbers.com.