Hunky Dory (2012)
| Theatrical Performance | ||
| Domestic Box Office | $20,296 | Details |
| International Box Office | $1,803 | Details |
| Worldwide Box Office | $22,099 | |
| OpusData ID: 187030100 More info... | ||
| Further financial details... | ||
Synopsis
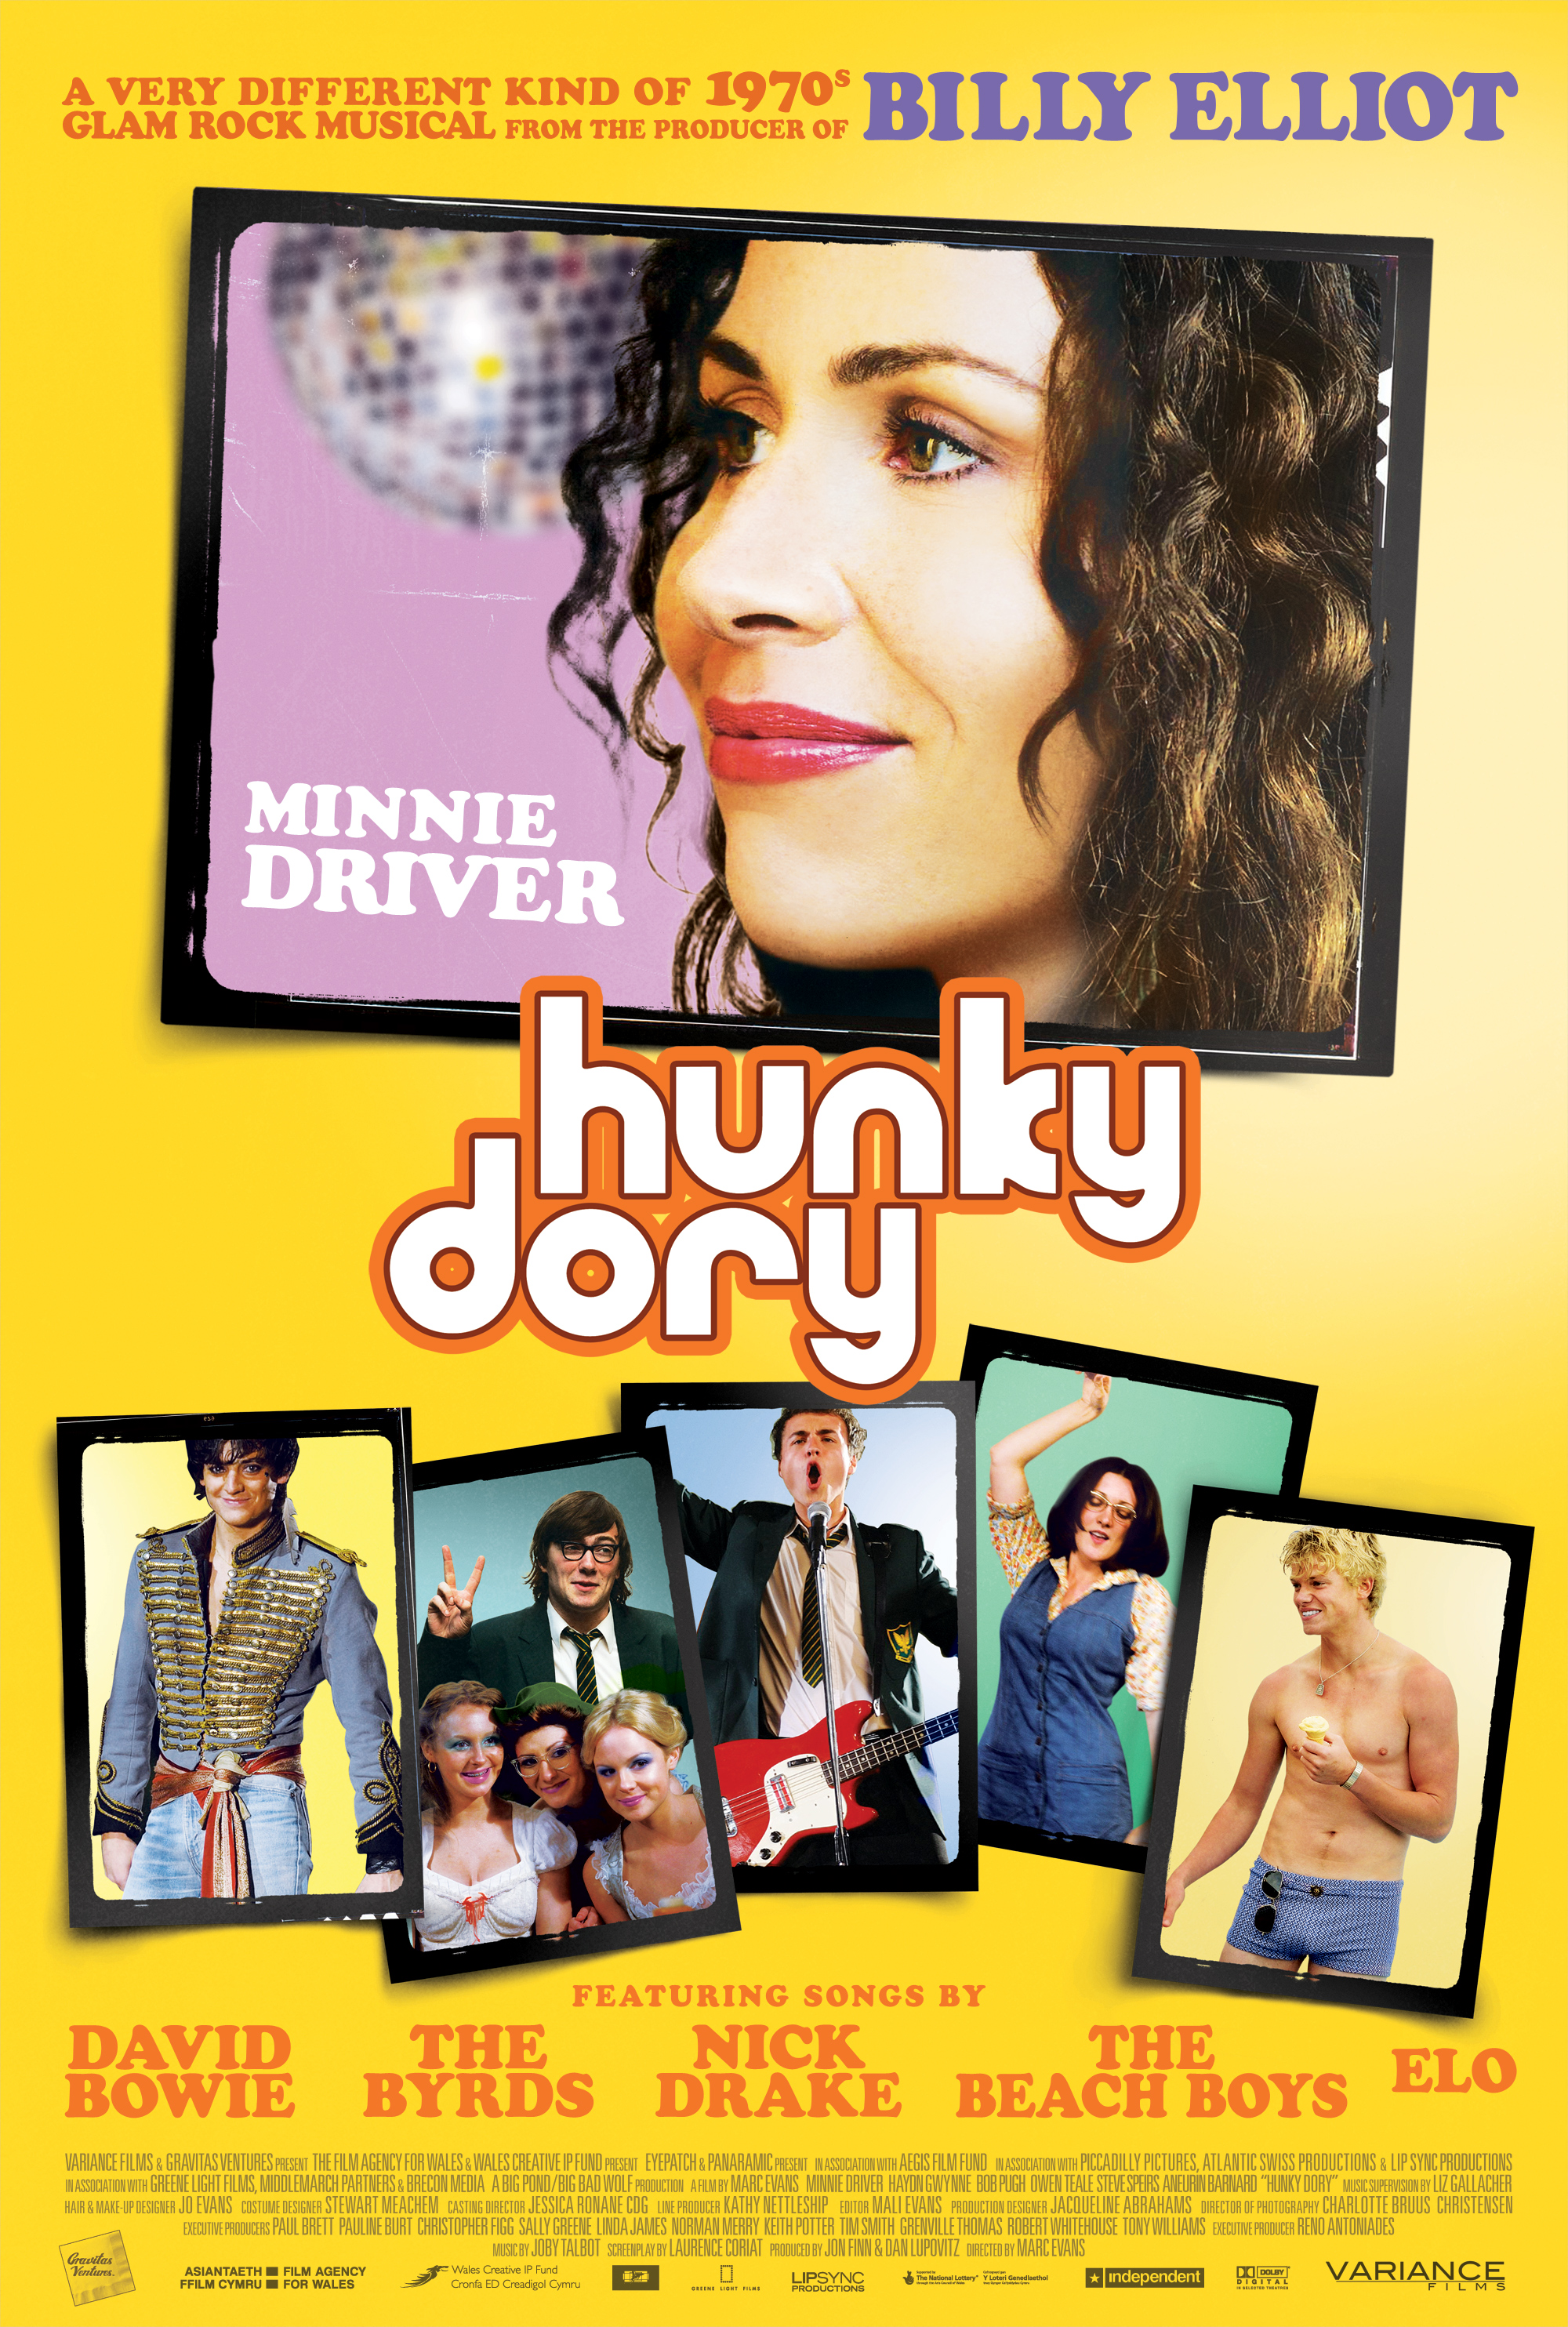
It’s the summer of 1976 in Wales, and Minnie Driver plays an idealistic high school drama teacher planning a concept rock-opera version of Shakespeare's The Tempest. But banish all thoughts of Glee or High School Musical-esque synthy pop songs from your mind, because the music in the film is from greats like David Bowie, ELO, The Beach Boys, and more -- and sung live on the set by the talented cast.
Metrics
| Opening Weekend: | $7,443 (36.7% of total gross) |
| Legs: | 2.73 (domestic box office/biggest weekend) |
| Domestic Share: | 91.8% (domestic box office/worldwide) |
| Theater counts: | 11 opening theaters/11 max. theaters, 2.5 weeks average run per theater |
| Infl. Adj. Dom. BO | $29,852 |
Movie Details
| Domestic Releases: | March 22nd, 2013 (Limited) by Variance Films |
| International Releases: | November 29th, 2012 (Wide) (New Zealand) |
| MPA Rating: | Not Rated |
| Running Time: | 109 minutes |
| Plot point: | Inspirational Teacher, Musicians, Performing Arts, Rock 'n' Roll |
| Source: | Original Screenplay |
| Genre: | Drama |
| Production Method: | Live Action |
| Creative Type: | Historical Fiction |
| Production/Financing Companies: | Big Pond Productions, Big Bad Wolf, Aegis Film Fund, Picadilly Pictures |
| Production Countries: | United Kingdom |
| Languages: | English |
Weekend Box Office Performance
| Date | Rank | Gross | % Change | Theaters | Per Theater | Total Gross | Week |
|---|---|---|---|---|---|---|---|
| Mar 22, 2013 | 79 | $7,443 | 11 | $677 | $7,443 | 1 | |
| Mar 29, 2013 | 98 | $2,695 | -64% | 6 | $449 | $12,836 | 2 |
| Apr 5, 2013 | 103 | $1,219 | -55% | 3 | $406 | $15,393 | 3 |
| Apr 12, 2013 | 95 | $1,129 | -7% | 3 | $376 | $17,073 | 4 |
| Apr 26, 2013 | 103 | $814 | 2 | $407 | $18,085 | 6 | |
| May 3, 2013 | 111 | $874 | +7% | 3 | $291 | $19,041 | 7 |
Weekly Box Office Performance
| Date | Rank | Gross | % Change | Theaters | Per Theater | Total Gross | Week |
|---|---|---|---|---|---|---|---|
| Mar 22, 2013 | 82 | $10,141 | 11 | $922 | $10,141 | 1 | |
| Mar 29, 2013 | 98 | $4,033 | -60% | 6 | $672 | $14,174 | 2 |
| Apr 5, 2013 | 109 | $1,770 | -56% | 3 | $590 | $15,944 | 3 |
| Apr 12, 2013 | 100 | $1,327 | -25% | 4 | $332 | $17,271 | 4 |
| Apr 26, 2013 | 109 | $896 | 2 | $448 | $18,167 | 6 | |
| May 3, 2013 | 111 | $2,147 | +140% | 5 | $429 | $20,296 | 7 |
Top International Territories
Box Office Summary Per Territory
| Territory | Release Date |
Opening Weekend |
Opening Weekend Screens/Theaters |
Maximum Screens/Theaters |
Theatrical Engagements |
Total Box Office |
Report Date |
|||
|---|---|---|---|---|---|---|---|---|---|---|
| New Zealand | 11/29/2012 | $1,803 | 15 | 15 | 15 | $1,803 | 12/12/2015 | |||
| International Total | $1,803 | 12/12/2015 | ||||||||
Note: Territories vary in whether they report screens or theaters. Full details on international box office data are available via our OpusData service.
Lead Ensemble Member
| Minnie Driver | Viv | |
| Haydn Gwynne | Miss Valentine |
Supporting
| Bob Pugh | Headmaster | |
| Owen Teale | Davy's Dad | |
| Steve Speirs | Mr. Cafferty |
Lead Ensemble Member
| Aneurin Barnard | Davy | |
| Danielle Branch | Stella | |
| Kristian Gwilliam | Hoople | |
| Tom Harries | Evan | |
| Adam Byard | Lewis | |
| George McKay | Jake |
Production and Technical Credits
| Marc Evans | Director | |
| Laurence Coriat | Screenwriter | |
| Jon Finn | Producer | |
| Dan Lupovitz | Producer | |
| Paul Brett | Executive Producer | |
| Pauline Burt | Executive Producer | |
| Christopher Figg | Executive Producer | |
| Sally Greene | Executive Producer | |
| Linda James | Executive Producer | |
| Norman Merry | Executive Producer | |
| Keith Potter | Executive Producer | |
| Tim Smith | Executive Producer | |
| Grenville Thomas | Executive Producer | |
| Robert Whitehouse | Executive Producer | |
| Tony Williams | Executive Producer | |
| Jacqueline Abrahams | Production Designer | |
| Charlotte Bruus Christensen | Director of Photography | |
| Jo Evans | Make-up and Hair Designer | |
| Mali Evans | Editor | |
| Joby Talbot | Composer | |
| Liz Gallacher | Music Supervisor | |
| Jeremy Holland-Smith | Songs Arranged & Orchestrated by | |
| Jody Talbot | Songs Arranged & Orchestrated by | |
| The Hunky Dory Orchestra | Songs Arranged & Orchestrated by | |
| Stewart Meachem | Costume Designer | |
| Simon Fraser | Sound Mixer | |
| Jessica Ronane | Casting Director | |
| Kathy Nettleship | Line Producer |
Cast and crew with above-the-line roles are marked in bold. The line marks the division between above-the-line and below-the-line roles.
Full financial estimates for this film, including domestic and international box office, video sales, video rentals, TV and ancillary revenue are available through our research services. For more information, please contact us at research@the-numbers.com.
Synopsis
It’s the summer of 1976 in Wales, and Minnie Driver plays an idealistic high school drama teacher planning a concept rock-opera version of Shakespeare's The Tempest. But banish all thoughts of Glee or High School Musical-esque synthy pop songs from your mind, because the music in the film is from greats like David Bowie, ELO, The Beach Boys, and more -- and sung live on the set by the talented cast.
Metrics
| Opening Weekend: | $7,443 (36.7% of total gross) |
| Legs: | 2.73 (domestic box office/biggest weekend) |
| Domestic Share: | 91.8% (domestic box office/worldwide) |
| Theater counts: | 11 opening theaters/11 max. theaters, 2.5 weeks average run per theater |
| Infl. Adj. Dom. BO | $29,852 |
Movie Details
| Domestic Releases: | March 22nd, 2013 (Limited) by Variance Films |
| International Releases: | November 29th, 2012 (Wide) (New Zealand) |
| MPA Rating: | Not Rated |
| Running Time: | 109 minutes |
| Plot point: | Inspirational Teacher, Musicians, Performing Arts, Rock 'n' Roll |
| Source: | Original Screenplay |
| Genre: | Drama |
| Production Method: | Live Action |
| Creative Type: | Historical Fiction |
| Production/Financing Companies: | Big Pond Productions, Big Bad Wolf, Aegis Film Fund, Picadilly Pictures |
| Production Countries: | United Kingdom |
| Languages: | English |
Weekend Box Office Performance
| Date | Rank | Gross | % Change | Theaters | Per Theater | Total Gross | Week |
|---|---|---|---|---|---|---|---|
| Mar 22, 2013 | 79 | $7,443 | 11 | $677 | $7,443 | 1 | |
| Mar 29, 2013 | 98 | $2,695 | -64% | 6 | $449 | $12,836 | 2 |
| Apr 5, 2013 | 103 | $1,219 | -55% | 3 | $406 | $15,393 | 3 |
| Apr 12, 2013 | 95 | $1,129 | -7% | 3 | $376 | $17,073 | 4 |
| Apr 26, 2013 | 103 | $814 | 2 | $407 | $18,085 | 6 | |
| May 3, 2013 | 111 | $874 | +7% | 3 | $291 | $19,041 | 7 |
Weekly Box Office Performance
| Date | Rank | Gross | % Change | Theaters | Per Theater | Total Gross | Week |
|---|---|---|---|---|---|---|---|
| Mar 22, 2013 | 82 | $10,141 | 11 | $922 | $10,141 | 1 | |
| Mar 29, 2013 | 98 | $4,033 | -60% | 6 | $672 | $14,174 | 2 |
| Apr 5, 2013 | 109 | $1,770 | -56% | 3 | $590 | $15,944 | 3 |
| Apr 12, 2013 | 100 | $1,327 | -25% | 4 | $332 | $17,271 | 4 |
| Apr 26, 2013 | 109 | $896 | 2 | $448 | $18,167 | 6 | |
| May 3, 2013 | 111 | $2,147 | +140% | 5 | $429 | $20,296 | 7 |
Top International Territories
Box Office Summary Per Territory
| Territory | Release Date |
Opening Weekend |
Opening Weekend Screens/Theaters |
Maximum Screens/Theaters |
Theatrical Engagements |
Total Box Office |
Report Date |
|||
|---|---|---|---|---|---|---|---|---|---|---|
| New Zealand | 11/29/2012 | $1,803 | 15 | 15 | 15 | $1,803 | 12/12/2015 | |||
| International Total | $1,803 | 12/12/2015 | ||||||||
Note: Territories vary in whether they report screens or theaters. Full details on international box office data are available via our OpusData service.
Lead Ensemble Member
| Minnie Driver | Viv | |
| Haydn Gwynne | Miss Valentine |
Supporting
| Bob Pugh | Headmaster | |
| Owen Teale | Davy's Dad | |
| Steve Speirs | Mr. Cafferty |
Lead Ensemble Member
| Aneurin Barnard | Davy | |
| Danielle Branch | Stella | |
| Kristian Gwilliam | Hoople | |
| Tom Harries | Evan | |
| Adam Byard | Lewis | |
| George McKay | Jake |
Production and Technical Credits
| Marc Evans | Director | |
| Laurence Coriat | Screenwriter | |
| Jon Finn | Producer | |
| Dan Lupovitz | Producer | |
| Paul Brett | Executive Producer | |
| Pauline Burt | Executive Producer | |
| Christopher Figg | Executive Producer | |
| Sally Greene | Executive Producer | |
| Linda James | Executive Producer | |
| Norman Merry | Executive Producer | |
| Keith Potter | Executive Producer | |
| Tim Smith | Executive Producer | |
| Grenville Thomas | Executive Producer | |
| Robert Whitehouse | Executive Producer | |
| Tony Williams | Executive Producer | |
| Jacqueline Abrahams | Production Designer | |
| Charlotte Bruus Christensen | Director of Photography | |
| Jo Evans | Make-up and Hair Designer | |
| Mali Evans | Editor | |
| Joby Talbot | Composer | |
| Liz Gallacher | Music Supervisor | |
| Jeremy Holland-Smith | Songs Arranged & Orchestrated by | |
| Jody Talbot | Songs Arranged & Orchestrated by | |
| The Hunky Dory Orchestra | Songs Arranged & Orchestrated by | |
| Stewart Meachem | Costume Designer | |
| Simon Fraser | Sound Mixer | |
| Jessica Ronane | Casting Director | |
| Kathy Nettleship | Line Producer |
Cast and crew with above-the-line roles are marked in bold. The line marks the division between above-the-line and below-the-line roles.
Full financial estimates for this film, including domestic and international box office, video sales, video rentals, TV and ancillary revenue are available through our research services. For more information, please contact us at research@the-numbers.com.