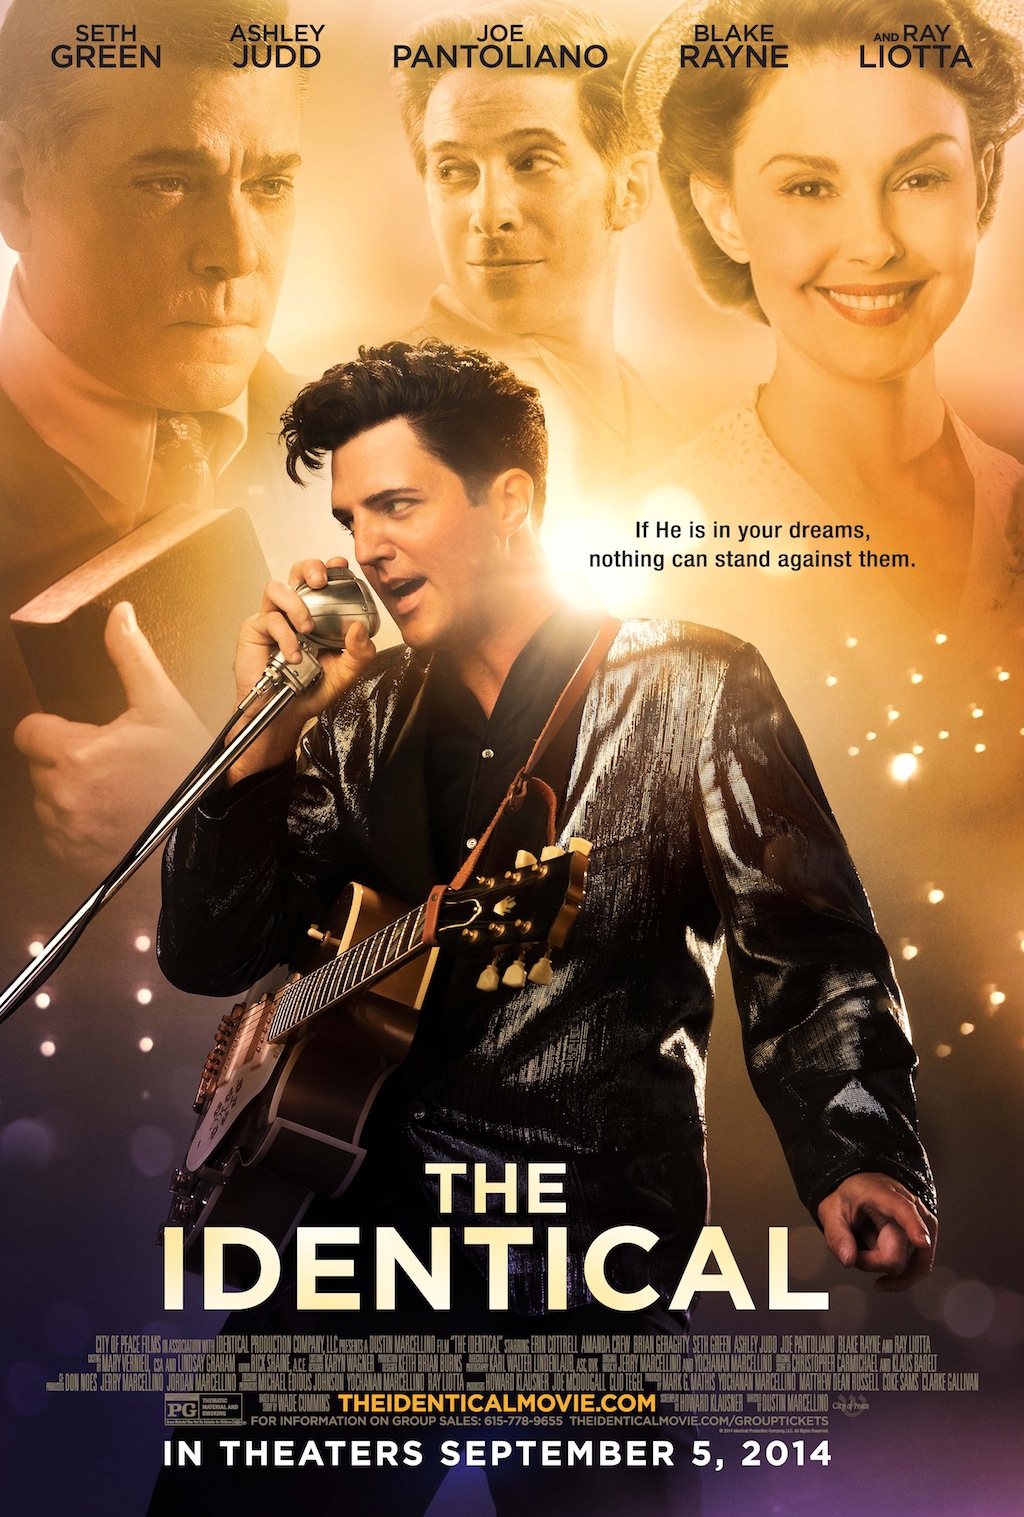
The Identical (2014)
| Theatrical Performance | ||
| Domestic Box Office | $2,827,666 | Details |
| Domestic Physical Disc Sales | ||
| DVD Sales (estimated) | $235,212 | |
| Blu-ray Sales (estimated) | $45,719 | |
| Total | $280,931 | |
| OpusData ID: 206430100 More info... | ||
| Further financial details... | ||
Synopsis
Identical twin brothers are separated at birth during the Great Depression. Their parents just cannot afford to give them both a life beyond poverty, so one is adopted by loving family. Despite their very different upbringings, the boys' shared passion for music causes their lives to unknowingly intersect as they experience a powerful and mysterious connection often felt by twins.
Metrics
| Opening Weekend: | $1,587,137 (56.1% of total gross) |
| Legs: | 1.78 (domestic box office/biggest weekend) |
| Domestic Share: | 100.0% (domestic box office/worldwide) |
| Theater counts: | 1,956 opening theaters/1,956 max. theaters, 1.7 weeks average run per theater |
| Infl. Adj. Dom. BO | $4,139,404 |
Movie Details
| Domestic Releases: | September 5th, 2014 (Wide) by Freestyle Releasing |
| Video Release: | January 13th, 2015 by Cinedigm |
| MPA Rating: | PG for thematic material and smoking. (Rating bulletin 2328, 6/25/2014) |
| Running Time: | 106 minutes |
| Cast, crew, or production detail: | Famously Bad |
| Plot point: | Family Secrets, Father’s Footsteps, Musicians, Religious, Separated at Birth, Singers, Twins |
| Social setting: | Adopted Family, Music Industry |
| Subgenre: | Family Drama |
| Source: | Original Screenplay |
| Genre: | Drama |
| Production Method: | Live Action |
| Creative Type: | Historical Fiction |
| Production/Financing Companies: | City of Peace Films, The Identical Production Company |
| Production Countries: | United States |
| Languages: | English |
Weekend Box Office Performance
| Date | Rank | Gross | % Change | Theaters | Per Theater | Total Gross | Week |
|---|---|---|---|---|---|---|---|
| Sep 5, 2014 | 12 | $1,587,137 | 1,956 | $811 | $1,587,137 | 1 | |
| Sep 12, 2014 | 23 | $401,983 | -75% | 1,274 | $316 | $2,576,495 | 2 |
| Sep 19, 2014 | 65 | $18,750 | -95% | 66 | $284 | $2,817,092 | 3 |
Daily Box Office Performance
| Date | Rank | Gross | %YD | %LW | Theaters | Per Theater | Total Gross | Days |
|---|---|---|---|---|---|---|---|---|
| Sep 5, 2014 | 11 | $532,544 | 1,956 | $272 | $532,544 | 1 | ||
| Sep 6, 2014 | 13 | $590,104 | +11% | 1,956 | $302 | $1,122,648 | 2 | |
| Sep 7, 2014 | 12 | $464,489 | -21% | 1,956 | $237 | $1,587,137 | 3 | |
| Sep 8, 2014 | 12 | $136,042 | -71% | 1,956 | $70 | $1,723,179 | 4 | |
| Sep 9, 2014 | 12 | $185,189 | +36% | 1,956 | $95 | $1,908,368 | 5 | |
| Sep 10, 2014 | 12 | $136,220 | -26% | 1,956 | $70 | $2,044,588 | 6 | |
| Sep 11, 2014 | 12 | $129,924 | -5% | 1,956 | $66 | $2,174,512 | 7 | |
| Sep 12, 2014 | - | $135,821 | +5% | -74% | 1,274 | $107 | $2,310,333 | 8 |
| Sep 13, 2014 | - | $161,846 | +19% | -73% | 1,274 | $127 | $2,472,179 | 9 |
| Sep 14, 2014 | - | $104,316 | -36% | -78% | 1,274 | $82 | $2,576,495 | 10 |
| Sep 15, 2014 | - | $50,992 | -51% | -63% | 1,274 | $40 | $2,627,487 | 11 |
| Sep 16, 2014 | - | $66,148 | +30% | -64% | 1,274 | $52 | $2,693,635 | 12 |
| Sep 17, 2014 | - | $53,440 | -19% | -61% | 1,274 | $42 | $2,747,075 | 13 |
| Sep 18, 2014 | 15 | $51,267 | -4% | -61% | 1,274 | $40 | $2,798,342 | 14 |
| Sep 19, 2014 | - | $6,804 | -87% | -95% | 66 | $103 | $2,805,146 | 15 |
| Sep 20, 2014 | - | $7,576 | +11% | -95% | 66 | $115 | $2,812,722 | 16 |
| Sep 21, 2014 | - | $4,370 | -42% | -96% | 66 | $66 | $2,817,092 | 17 |
| Sep 22, 2014 | - | $3,030 | -31% | -94% | 66 | $46 | $2,820,122 | 18 |
| Sep 23, 2014 | - | $2,824 | -7% | -96% | 66 | $43 | $2,822,946 | 19 |
| Sep 24, 2014 | - | $2,525 | -11% | -95% | 66 | $38 | $2,825,471 | 20 |
| Sep 25, 2014 | - | $2,195 | -13% | -96% | 66 | $33 | $2,827,666 | 21 |
Weekly Box Office Performance
| Date | Rank | Gross | % Change | Theaters | Per Theater | Total Gross | Week |
|---|---|---|---|---|---|---|---|
| Sep 5, 2014 | 12 | $2,174,512 | 1,956 | $1,112 | $2,174,512 | 1 | |
| Sep 12, 2014 | 18 | $623,830 | -71% | 1,274 | $490 | $2,798,342 | 2 |
| Sep 19, 2014 | 58 | $29,324 | -95% | 66 | $444 | $2,827,666 | 3 |
Leading
| Seth Green | Dino | |
| Ashley Judd | Louise Wade |
Supporting
| Joe Pantoliano | Avi Hirschberg |
Leading
| Blake Rayne | Ryan Wade | |
| Ray Liotta | Reece Wade |
Supporting
| Erin Cotrell | Jenny O'Brien | |
| Amanda Crew | Helen Hemsley | |
| Brian Geraghty | William Hemsley | |
| Waylon Payne | Tony Nash | |
| Danny Woodburn | Damon | |
| Chris Mulkey | William Hemsley (Older) | |
| Noah Urrea | Ryan Wade (9 Years) | |
| Gary Beaty | Steve Douglas | |
| Caylin Cervetti | Angela | |
| Ken Dodge | Sergeant | |
| Joanne Goldstein | Tour Guide | |
| Michael Johnson | Tour Bus Driver | |
| Brad Jones | Ray Reynolds | |
| Howard Klausner | Emcee | |
| Yochanan Marcellino | Record Executive | |
| Joe McDougall | Sheriff | |
| William McKinney | Policeman | |
| Leslie Mills | Redhead | |
| Ian Mitchell | Dino (9 Years) | |
| Brad Naylor | Fair Announcer | |
| John Newberg | Dr. Jennings | |
| Chris Finley | Jenny's Dad | |
| Cole Schaefer | Dino's Dad | |
| Chris Scruggs | Danny Martin | |
| Lisa Stewart Seals | Darla | |
| Kevin Shell | Boss Man | |
| Jacqueline Steele | Cheryl Rogers | |
| J. Karen Thomas | Annie | |
| Jeremy Walker | Sammy Wright | |
| Michael Joiner | State Trooper | |
| Wade Cummins | Contestant #1 | |
| James Carslake | Backup Singer | |
| Raquel Payne | Backup Singer #2 | |
| Katie Freeman | Screaming Girl #1 | |
| Nathan Clark George | Tent Revival Hymn Leader | |
| Shelly Justice | Church Choir #4 | |
| Hunter Mobley | Church Choir #5 |
Production and Technical Credits
| Dustin Marcellino | Director | |
| Howard Klausner | Screenwriter | |
| Wade Cummins | Story Creator | |
| Mark G. Mathis | Producer | |
| Yochanan Marcellino | Producer | |
| Matthew Dean Russell | Producer | |
| Coke Sams | Producer | |
| J. Clarke Gallivan | Producer | |
| Howard Klausner | Producer | |
| Joe McDougall | Producer | |
| Michael Edious Johnson | Executive Producer | |
| Yochanan Marcellino | Executive Producer | |
| Don Noes | Co-Producer | |
| Jerry Marcellino | Co-Producer | |
| Christopher Carmichael | Song Writer | |
| Klaus Badelt | Song Writer | |
| Jerry Marcellino | Composer | |
| Yochanan Marcellino | Composer | |
| Karl Walter Lindenlaub | Director of Photography | |
| Keith Brian Burns | Production Designer | |
| Karyn Wagner | Costume Designer | |
| Rick Shaine | Editor | |
| Mary Vernieu | Casting Director | |
| Lindsay Graham | Casting Director | |
| Liba Daniels | Art Director | |
| Bayard Carey | Sound Mixer | |
| Alisa Fredericks | Assistant Director |
Cast and crew with above-the-line roles are marked in bold. The line marks the division between above-the-line and below-the-line roles.
Full financial estimates for this film, including domestic and international box office, video sales, video rentals, TV and ancillary revenue are available through our research services. For more information, please contact us at research@the-numbers.com.