In the Life of Music (2020)
| Theatrical Performance | ||
| Domestic Box Office | $7,238 | Details |
| OpusData ID: 460250100 More info... | ||
| Further financial details... | ||
Synopsis
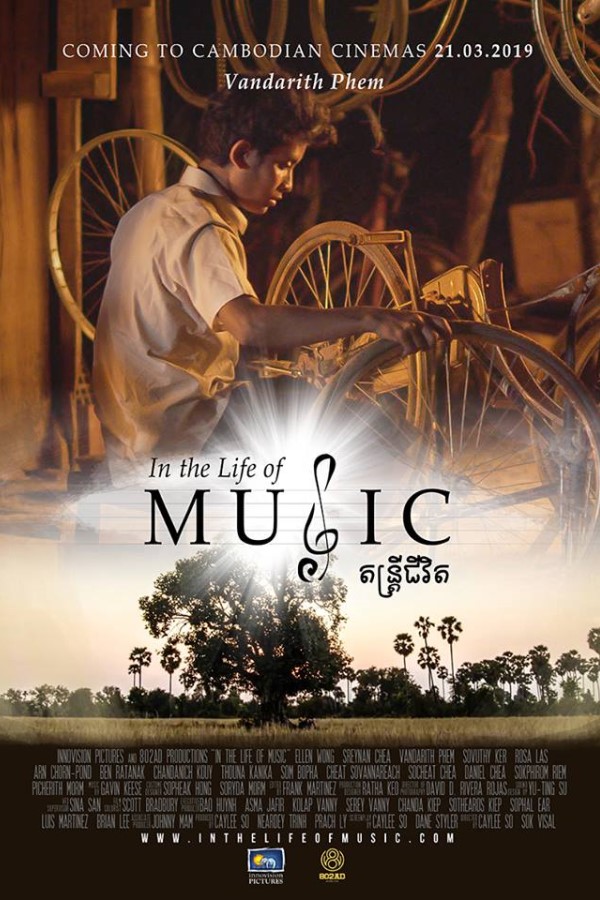
In the Life of Music follows the journey of Hope, a young American girl visiting her relatives in Cambodia for the first time. Determined to learn the history of her parents, Hope discovers the story of how one song, “Champa Battambang” played an integral part of three generations. Starting with how her parents met and fell in love in 1968, to their fight for survival during the war-torn Khmer Rouge years of the 1970’s and finally finishing in the modern day with Hope getting the answers she has longed for.
Metrics
| Opening Weekend: | $897 (12.4% of total gross) |
| Legs: | 6.39 (domestic box office/biggest weekend) |
| Domestic Share: | 100.0% (domestic box office/worldwide) |
| Theater counts: | 1 opening theaters/1 max. theaters, 8.0 weeks average run per theater |
| Infl. Adj. Dom. BO | $9,293 |
Movie Details
| Domestic Releases: | August 14th, 2020 (Limited) by Indican Pictures |
| Video Release: | September 15th, 2020 by Indican Home |
| Running Time: | 92 minutes |
| Source: | Original Screenplay |
| Genre: | Drama |
| Production Method: | Live Action |
| Creative Type: | Multiple Creative Types |
| Production/Financing Companies: | Innovision Pictures, 802AD |
| Production Countries: | Cambodia |
| Languages: | English, Khmer |
Weekend Box Office Performance
| Date | Rank | Gross | % Change | Theaters | Per Theater | Total Gross | Week |
|---|---|---|---|---|---|---|---|
| Aug 14, 2020 | - | $897 | 1 | $897 | $897 | 1 | |
| Aug 21, 2020 | - | $1,133 | +26% | 1 | $1,133 | $2,232 | 2 |
| Aug 28, 2020 | 22 | $502 | -56% | 1 | $502 | $3,142 | 3 |
| Sep 4, 2020 | - | $494 | -2% | 1 | $494 | $4,123 | 4 |
| Sep 11, 2020 | - | $757 | +53% | 1 | $757 | $5,510 | 5 |
| Nov 20, 2020 | - | $297 | 1 | $297 | $6,069 | 15 | |
| Jan 22, 2021 | - | $333 | 1 | $333 | $6,514 | 24 | |
| Jan 29, 2021 | - | $145 | -56% | 1 | $145 | $7,046 | 25 |
Weekly Box Office Performance
| Date | Rank | Gross | % Change | Theaters | Per Theater | Total Gross | Week |
|---|---|---|---|---|---|---|---|
| Aug 14, 2020 | - | $1,099 | 1 | $1,099 | $1,099 | 1 | |
| Aug 21, 2020 | - | $1,541 | +40% | 1 | $1,541 | $2,640 | 2 |
| Aug 28, 2020 | 24 | $989 | -36% | 1 | $989 | $3,629 | 3 |
| Sep 4, 2020 | - | $871 | -12% | 1 | $871 | $4,753 | 4 |
| Sep 11, 2020 | - | $1,019 | +17% | 1 | $1,019 | $5,772 | 5 |
| Nov 20, 2020 | - | $409 | 1 | $409 | $6,181 | 15 | |
| Jan 22, 2021 | - | $720 | 1 | $720 | $6,901 | 24 | |
| Jan 29, 2021 | - | $337 | -53% | 1 | $337 | $7,238 | 25 |
Full financial estimates for this film, including domestic and international box office, video sales, video rentals, TV and ancillary revenue are available through our research services. For more information, please contact us at research@the-numbers.com.
Synopsis
In the Life of Music follows the journey of Hope, a young American girl visiting her relatives in Cambodia for the first time. Determined to learn the history of her parents, Hope discovers the story of how one song, “Champa Battambang” played an integral part of three generations. Starting with how her parents met and fell in love in 1968, to their fight for survival during the war-torn Khmer Rouge years of the 1970’s and finally finishing in the modern day with Hope getting the answers she has longed for.
Metrics
| Opening Weekend: | $897 (12.4% of total gross) |
| Legs: | 6.39 (domestic box office/biggest weekend) |
| Domestic Share: | 100.0% (domestic box office/worldwide) |
| Theater counts: | 1 opening theaters/1 max. theaters, 8.0 weeks average run per theater |
| Infl. Adj. Dom. BO | $9,293 |
Movie Details
| Domestic Releases: | August 14th, 2020 (Limited) by Indican Pictures |
| Video Release: | September 15th, 2020 by Indican Home |
| Running Time: | 92 minutes |
| Source: | Original Screenplay |
| Genre: | Drama |
| Production Method: | Live Action |
| Creative Type: | Multiple Creative Types |
| Production/Financing Companies: | Innovision Pictures, 802AD |
| Production Countries: | Cambodia |
| Languages: | English, Khmer |
Weekend Box Office Performance
| Date | Rank | Gross | % Change | Theaters | Per Theater | Total Gross | Week |
|---|---|---|---|---|---|---|---|
| Aug 14, 2020 | - | $897 | 1 | $897 | $897 | 1 | |
| Aug 21, 2020 | - | $1,133 | +26% | 1 | $1,133 | $2,232 | 2 |
| Aug 28, 2020 | 22 | $502 | -56% | 1 | $502 | $3,142 | 3 |
| Sep 4, 2020 | - | $494 | -2% | 1 | $494 | $4,123 | 4 |
| Sep 11, 2020 | - | $757 | +53% | 1 | $757 | $5,510 | 5 |
| Nov 20, 2020 | - | $297 | 1 | $297 | $6,069 | 15 | |
| Jan 22, 2021 | - | $333 | 1 | $333 | $6,514 | 24 | |
| Jan 29, 2021 | - | $145 | -56% | 1 | $145 | $7,046 | 25 |
Weekly Box Office Performance
| Date | Rank | Gross | % Change | Theaters | Per Theater | Total Gross | Week |
|---|---|---|---|---|---|---|---|
| Aug 14, 2020 | - | $1,099 | 1 | $1,099 | $1,099 | 1 | |
| Aug 21, 2020 | - | $1,541 | +40% | 1 | $1,541 | $2,640 | 2 |
| Aug 28, 2020 | 24 | $989 | -36% | 1 | $989 | $3,629 | 3 |
| Sep 4, 2020 | - | $871 | -12% | 1 | $871 | $4,753 | 4 |
| Sep 11, 2020 | - | $1,019 | +17% | 1 | $1,019 | $5,772 | 5 |
| Nov 20, 2020 | - | $409 | 1 | $409 | $6,181 | 15 | |
| Jan 22, 2021 | - | $720 | 1 | $720 | $6,901 | 24 | |
| Jan 29, 2021 | - | $337 | -53% | 1 | $337 | $7,238 | 25 |
Full financial estimates for this film, including domestic and international box office, video sales, video rentals, TV and ancillary revenue are available through our research services. For more information, please contact us at research@the-numbers.com.