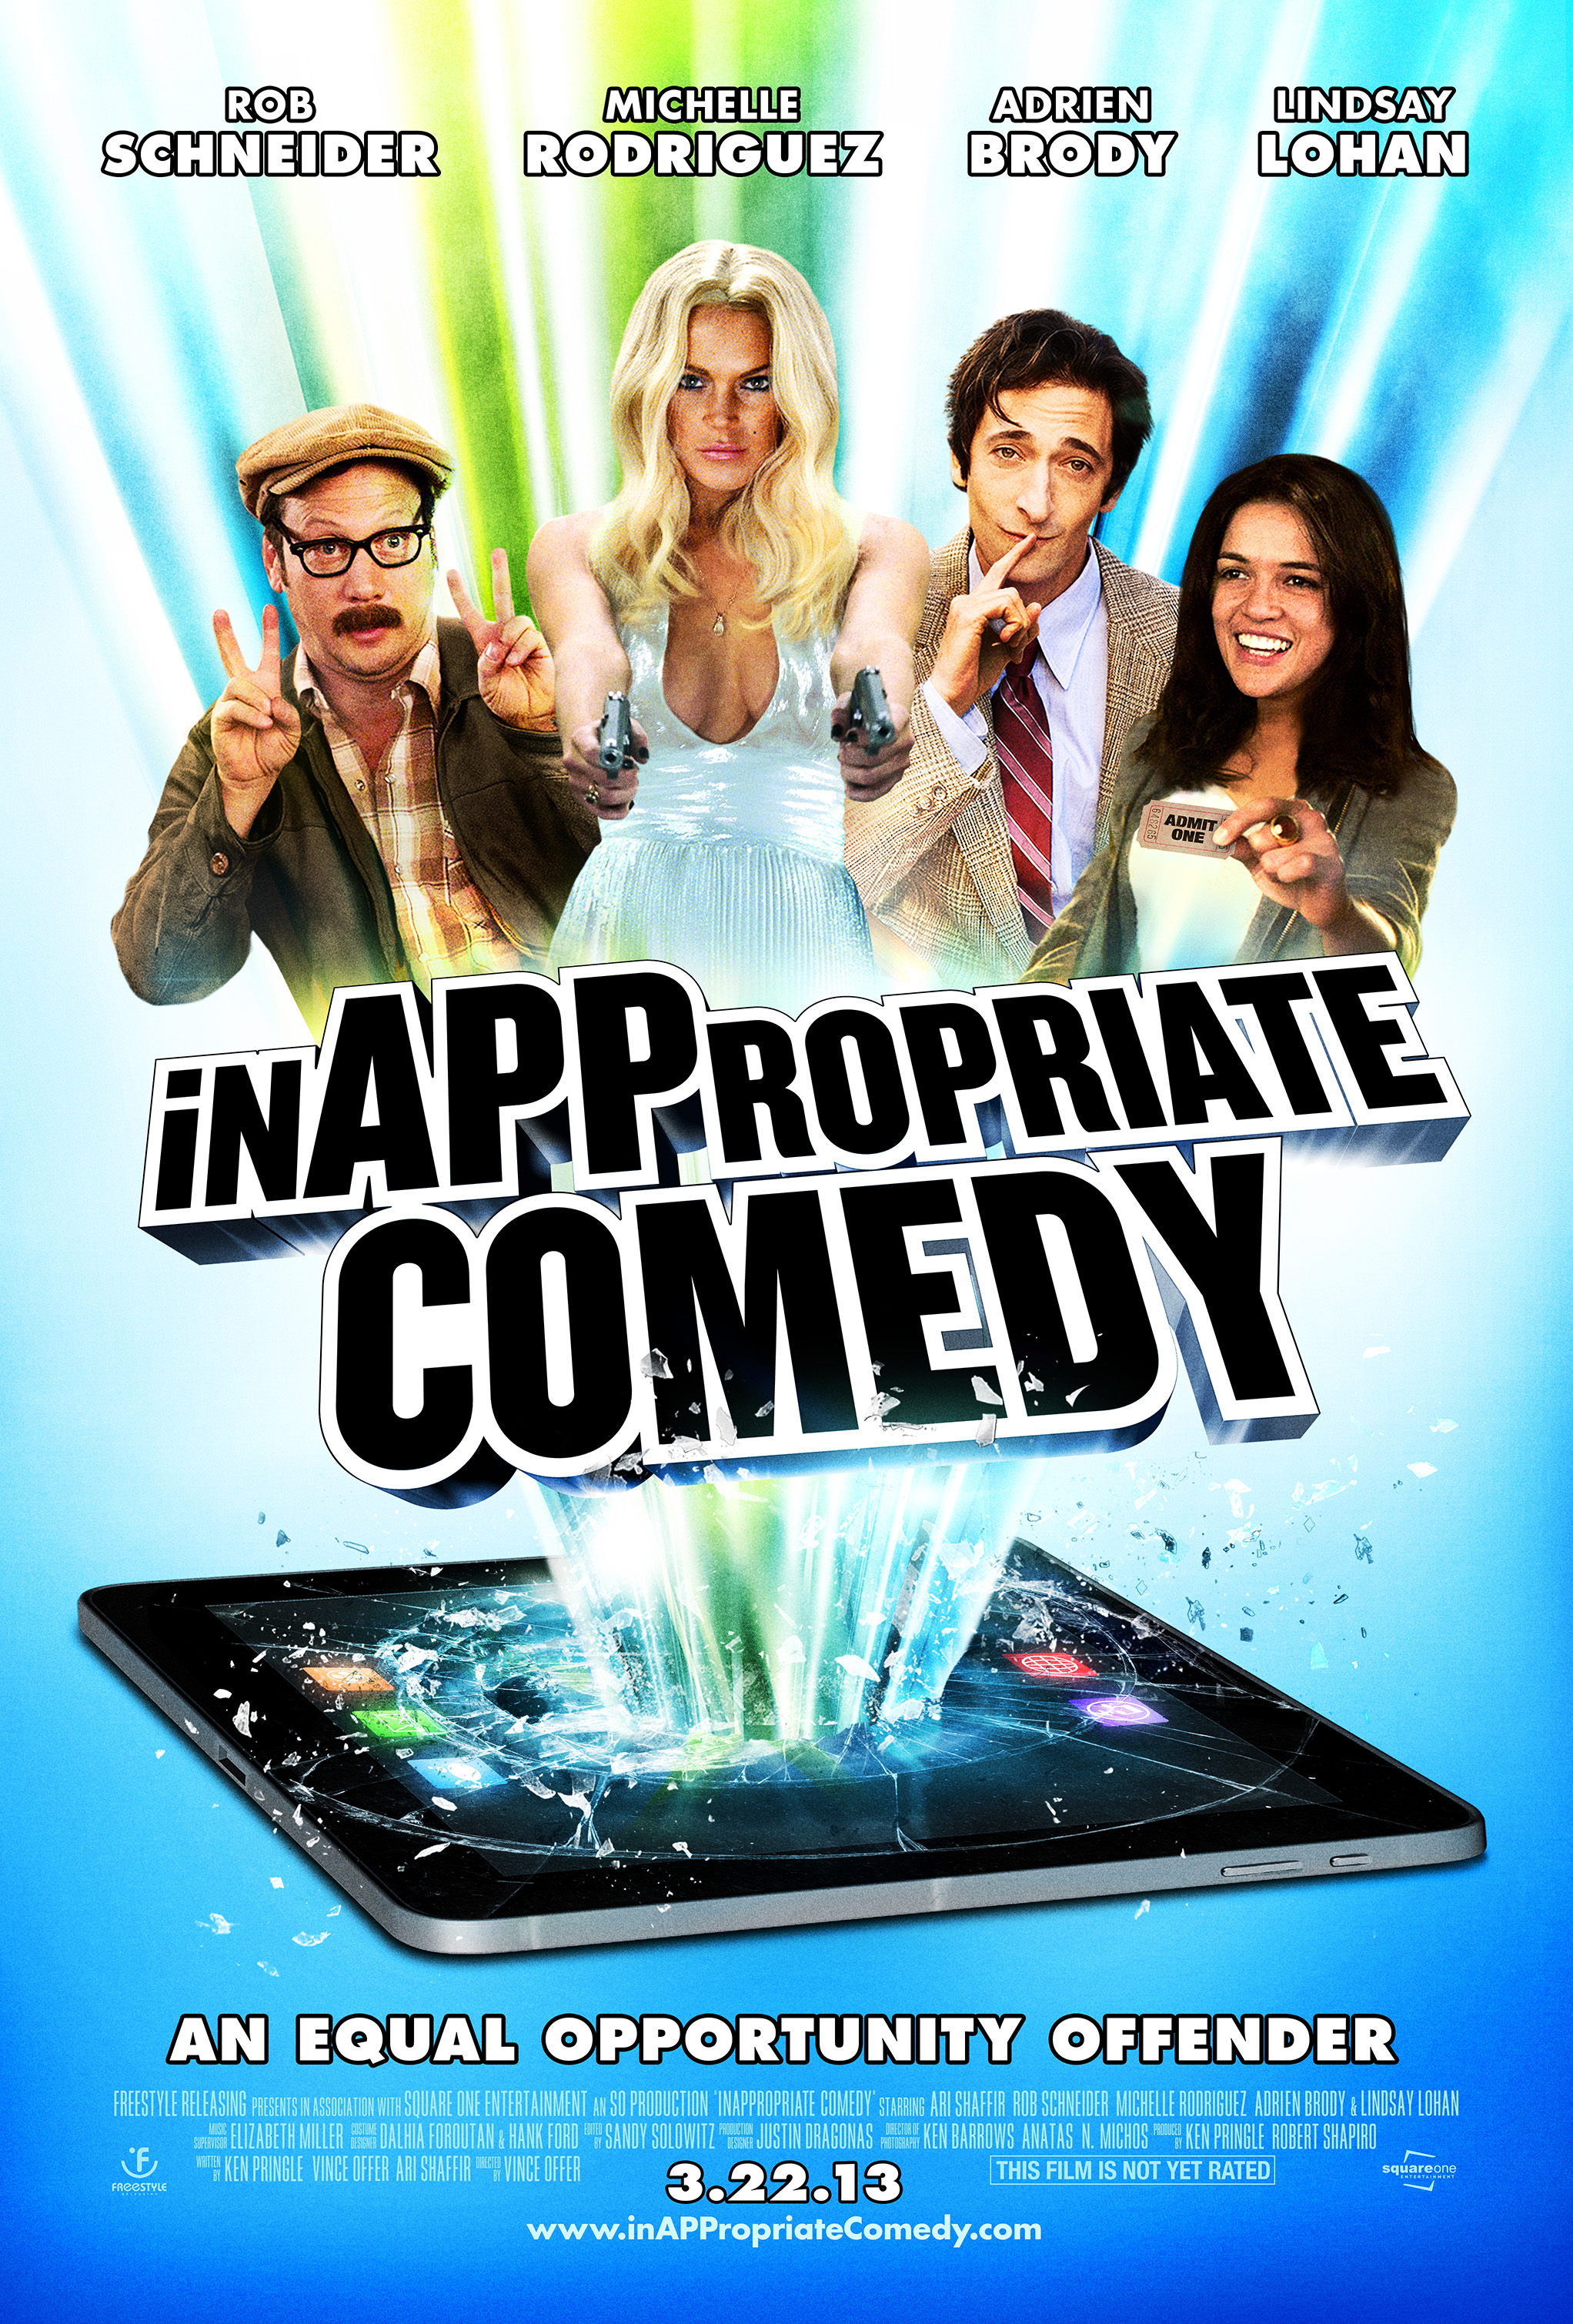
InAPPropriate Comedy (2013)
| Theatrical Performance | ||
| Domestic Box Office | $228,004 | Details |
| OpusData ID: 183830100 More info... | ||
| Further financial details... | ||
Synopsis
An offensive sketch comedy.
Metrics
| Opening Weekend: | $156,414 (68.6% of total gross) |
| Legs: | 1.46 (domestic box office/biggest weekend) |
| Domestic Share: | 100.0% (domestic box office/worldwide) |
| Theater counts: | 275 opening theaters/275 max. theaters, 1.0 weeks average run per theater |
| Infl. Adj. Dom. BO | $335,418 |
Movie Details
| Domestic Releases: | March 22nd, 2013 (Limited) by Freestyle Releasing |
| MPA Rating: | R for strong crude and sexual content, graphic nudity, pervasive language and drug use. (Rating bulletin 2257, 1/30/2013) |
| Running Time: | 84 minutes |
| Cast, crew, or production detail: | Ensemble, Same Actor, Multiple Roles, Segments |
| Plot point: | Spoof |
| Subgenre: | Sketch Comedy |
| Source: | Original Screenplay |
| Genre: | Comedy |
| Production Method: | Live Action |
| Creative Type: | Contemporary Fiction |
| Production/Financing Companies: | Freestyle Releasing, Square One Entertainment, So |
| Production Countries: | United States |
| Languages: | English |
Weekend Box Office Performance
| Date | Rank | Gross | % Change | Theaters | Per Theater | Total Gross | Week |
|---|---|---|---|---|---|---|---|
| Mar 22, 2013 | 32 | $156,414 | 275 | $569 | $156,414 | 1 |
Daily Box Office Performance
| Date | Rank | Gross | % Change | Theaters | Per Theater | Total Gross | Days |
|---|---|---|---|---|---|---|---|
| Mar 22, 2013 | - | $57,753 | 275 | $210 | $57,753 | 1 | |
| Mar 23, 2013 | - | $58,889 | +2% | 275 | $214 | $116,642 | 2 |
| Mar 24, 2013 | - | $39,772 | -32% | 275 | $145 | $156,414 | 3 |
| Mar 25, 2013 | - | $19,984 | -50% | 275 | $73 | $176,398 | 4 |
| Mar 26, 2013 | - | $20,880 | +4% | 275 | $76 | $197,278 | 5 |
| Mar 27, 2013 | - | $14,841 | -29% | 275 | $54 | $212,119 | 6 |
| Mar 28, 2013 | - | $15,885 | +7% | 275 | $58 | $228,004 | 7 |
Weekly Box Office Performance
| Date | Rank | Gross | % Change | Theaters | Per Theater | Total Gross | Week |
|---|---|---|---|---|---|---|---|
| Mar 22, 2013 | 33 | $228,004 | 275 | $829 | $228,004 | 1 |
Full financial estimates for this film, including domestic and international box office, video sales, video rentals, TV and ancillary revenue are available through our research services. For more information, please contact us at research@the-numbers.com.