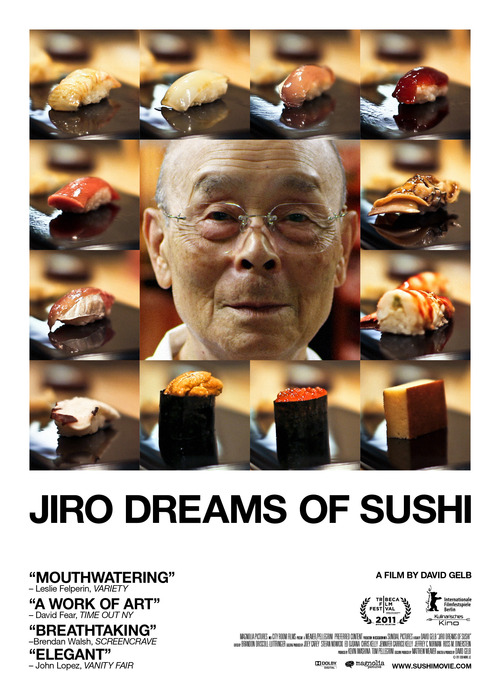
Jiro Dreams of Sushi (2012)
| Theatrical Performance | ||
| Domestic Box Office | $2,552,478 | Details |
| International Box Office | $237,557 | Details |
| Worldwide Box Office | $2,790,035 | |
| OpusData ID: 169290100 More info... | ||
| Further financial details... | ||
Synopsis
The story of 85 year-old Jiro Ono, considered by many to be the world’s greatest sushi chef. He is the proprietor of Sukiyabashi Jiro, a 10-seat, sushi-only restaurant inauspiciously located in a Tokyo subway station. Despite its humble appearances, it is the first restaurant of its kind to be awarded a prestigious 3 star Michelin review, and sushi lovers from around the globe make repeated pilgrimages, calling months in advance and shelling out top dollar for a coveted seat at Jiro’s sushi bar. For most of his life, Jiro has been mastering the art of making sushi, but even at his age he sees himself still striving for perfection, working from sunrise to well beyond sunset to taste every piece of fish; meticulously train his employees; and carefully mold and finesse the impeccable presentation of each sushi creation. At the heart of this story is Jiro’s relationship with his eldest son Yoshikazu, the worthy heir to Jiro’s legacy, who is unable to live up to his full potential in his father’s shadow.
Metrics
| Opening Weekend: | $42,035 (1.6% of total gross) |
| Legs: | 11.07 (domestic box office/biggest weekend) |
| Domestic Share: | 91.5% (domestic box office/worldwide) |
| Theater counts: | 2 opening theaters/80 max. theaters, 9.1 weeks average run per theater |
| Infl. Adj. Dom. BO | $3,835,129 |
Movie Details
| Domestic Releases: | March 9th, 2012 (Limited) by Magnolia Pictures |
| International Releases: | May 25th, 2012 (Wide) (Poland)
July 26th, 2012 (Wide) (Singapore) December 20th, 2012 (Wide) (Hungary) January 11th, 2013 (Wide) (United Kingdom) ... Show all releases |
| Video Release: | July 24th, 2012 by Magnolia Home Entertainment |
| MPA Rating: | PG for mild thematic elements and brief smoking. (Rating bulletin 2195, 10/26/2011) |
| Running Time: | 81 minutes |
| Cast, crew, or production detail: | Digital Cinematography, Voiceover/Narration |
| Plot point: | Autumn Years, Biography, Dysfunctional Family, Father’s Footsteps, Food, Gastronomy |
| Social setting: | Retirement |
| Subgenre: | Biographical Documentary |
| Source: | Based on Real Life Events |
| Genre: | Documentary |
| Production Method: | Live Action |
| Creative Type: | Factual |
| Production/Financing Companies: | City Room Media, Preferred Content, Sundial Pictures, Weaver/Pellegrini Productions |
| Production Countries: | Japan |
| Languages: | Japanese |
Weekend Box Office Performance
| Date | Rank | Gross | % Change | Theaters | Per Theater | Total Gross | Week |
|---|---|---|---|---|---|---|---|
| Mar 9, 2012 | 55 | $42,035 | 2 | $21,018 | $42,035 | 1 | |
| Mar 16, 2012 | 40 | $91,214 | +117% | 6 | $15,202 | $156,354 | 2 |
| Mar 23, 2012 | 29 | $175,162 | +92% | 27 | $6,487 | $381,555 | 3 |
| Mar 30, 2012 | 25 | $193,541 | +10% | 44 | $4,399 | $665,827 | 4 |
| Apr 6, 2012 | 21 | $230,504 | +19% | 72 | $3,201 | $992,421 | 5 |
| Apr 13, 2012 | 26 | $198,430 | -14% | 79 | $2,512 | $1,280,454 | 6 |
| Apr 20, 2012 | 25 | $179,887 | -9% | 77 | $2,336 | $1,564,516 | 7 |
| Apr 27, 2012 | 27 | $150,350 | -16% | 80 | $1,879 | $1,815,423 | 8 |
| May 4, 2012 | 29 | $95,125 | -37% | 73 | $1,303 | $1,990,302 | 9 |
| May 11, 2012 | 35 | $71,192 | -25% | 54 | $1,318 | $2,116,746 | 10 |
| May 18, 2012 | 41 | $36,565 | -49% | 41 | $892 | $2,194,128 | 11 |
| May 25, 2012 | 40 | $44,104 | +21% | 35 | $1,260 | $2,269,172 | 12 |
| Jun 1, 2012 | 44 | $32,811 | -26% | 29 | $1,131 | $2,337,696 | 13 |
| Jun 8, 2012 | 50 | $26,003 | -21% | 25 | $1,040 | $2,386,043 | 14 |
| Jun 15, 2012 | 55 | $18,788 | -28% | 19 | $989 | $2,426,084 | 15 |
| Jun 22, 2012 | 54 | $15,946 | -15% | 15 | $1,063 | $2,456,148 | 16 |
| Jun 29, 2012 | 52 | $12,307 | -23% | 11 | $1,119 | $2,480,095 | 17 |
| Jul 6, 2012 | 54 | $10,510 | -15% | 11 | $955 | $2,502,590 | 18 |
| Jul 13, 2012 | 61 | $10,166 | -3% | 8 | $1,271 | $2,518,245 | 19 |
| Jul 20, 2012 | 68 | $4,967 | -51% | 5 | $993 | $2,527,419 | 20 |
| Jul 27, 2012 | 73 | $2,905 | -42% | 4 | $726 | $2,533,621 | 21 |
| Aug 3, 2012 | 74 | $4,258 | +47% | 6 | $710 | $2,541,858 | 22 |
| Aug 10, 2012 | 82 | $3,137 | -26% | 3 | $1,046 | $2,545,988 | 23 |
| Aug 17, 2012 | 81 | $2,172 | -31% | 3 | $724 | $2,550,508 | 24 |
Weekly Box Office Performance
| Date | Rank | Gross | % Change | Theaters | Per Theater | Total Gross | Week |
|---|---|---|---|---|---|---|---|
| Mar 9, 2012 | 56 | $65,140 | 2 | $32,570 | $65,140 | 1 | |
| Mar 16, 2012 | 39 | $141,253 | +117% | 6 | $23,542 | $206,393 | 2 |
| Mar 23, 2012 | 25 | $265,893 | +88% | 27 | $9,848 | $472,286 | 3 |
| Mar 30, 2012 | 26 | $289,631 | +9% | 44 | $6,583 | $761,917 | 4 |
| Apr 6, 2012 | 22 | $320,107 | +11% | 72 | $4,446 | $1,082,024 | 5 |
| Apr 13, 2012 | 24 | $302,605 | -5% | 79 | $3,830 | $1,384,629 | 6 |
| Apr 20, 2012 | 23 | $280,444 | -7% | 77 | $3,642 | $1,665,073 | 7 |
| Apr 27, 2012 | 24 | $230,104 | -18% | 80 | $2,876 | $1,895,177 | 8 |
| May 4, 2012 | 29 | $150,377 | -35% | 73 | $2,060 | $2,045,554 | 9 |
| May 11, 2012 | 36 | $112,009 | -26% | 54 | $2,074 | $2,157,563 | 10 |
| May 18, 2012 | 39 | $67,505 | -40% | 41 | $1,646 | $2,225,068 | 11 |
| May 25, 2012 | 39 | $79,817 | +18% | 35 | $2,280 | $2,304,885 | 12 |
| Jun 1, 2012 | 46 | $55,155 | -31% | 29 | $1,902 | $2,360,040 | 13 |
| Jun 8, 2012 | 49 | $47,256 | -14% | 25 | $1,890 | $2,407,296 | 14 |
| Jun 15, 2012 | 51 | $32,906 | -30% | 19 | $1,732 | $2,440,202 | 15 |
| Jun 22, 2012 | 54 | $27,586 | -16% | 15 | $1,839 | $2,467,788 | 16 |
| Jun 29, 2012 | 55 | $24,292 | -12% | 11 | $2,208 | $2,492,080 | 17 |
| Jul 6, 2012 | 53 | $15,999 | -34% | 11 | $1,454 | $2,508,079 | 18 |
| Jul 13, 2012 | 63 | $14,373 | -10% | 8 | $1,797 | $2,522,452 | 19 |
| Jul 20, 2012 | 65 | $8,264 | -43% | 5 | $1,653 | $2,530,716 | 20 |
| Jul 27, 2012 | 68 | $6,884 | -17% | 4 | $1,721 | $2,537,600 | 21 |
| Aug 3, 2012 | 77 | $5,251 | -24% | 6 | $875 | $2,542,851 | 22 |
| Aug 10, 2012 | 74 | $5,485 | +4% | 3 | $1,828 | $2,548,336 | 23 |
| Aug 17, 2012 | 80 | $4,142 | -24% | 3 | $1,381 | $2,552,478 | 24 |
Top International Territories
Box Office Summary Per Territory
| Territory | Release Date |
Opening Weekend |
Opening Weekend Screens/Theaters |
Maximum Screens/Theaters |
Theatrical Engagements |
Total Box Office |
Report Date |
|||
|---|---|---|---|---|---|---|---|---|---|---|
| Hungary | 12/20/2012 | $4,617 | 10 | 10 | 10 | $4,617 | 12/29/2018 | |||
| Poland | 5/25/2012 | $4,772 | 8 | 8 | 8 | $5,530 | 12/29/2018 | |||
| Singapore | 7/26/2012 | $14,250 | 2 | 2 | 13 | $72,108 | 12/11/2015 | |||
| United Kingdom | 1/11/2013 | $14,440 | 6 | 6 | 10 | $40,660 | 12/14/2015 | |||
| Rest of World | $114,642 | |||||||||
| International Total | $237,557 | 12/29/2018 | ||||||||
Note: Territories vary in whether they report screens or theaters. Full details on international box office data are available via our OpusData service.
Documentary Subject
| Jiro Ono | Himself |
Interviewee
| Yoshikazu Ono | Himself | |
| Takashi Ono | Herself | |
| Yamamoto Masuhiro | Himself |
Production and Technical Credits
| David Gelb | Director | |
| David Gelb | Producer | |
| Matthew Weaver | Executive Producer | |
| Joey Carey | Executive Producer | |
| Stefan Nowicki | Executive Producer | |
| Chris Kelly | Executive Producer | |
| Jennifer Kelly | Executive Producer | |
| Kevin Iwashina | Producer | |
| Tom Pellegrini | Producer | |
| Brandon Driscoll-Luttringer | Editor | |
| Ross M. Dinerstein | Co-Executive Producer | |
| Jeremy Umland | Co-Executive Producer | |
| Ed Odjana | Co-Executive Producer |
Cast and crew with above-the-line roles are marked in bold. The line marks the division between above-the-line and below-the-line roles.
Full financial estimates for this film, including domestic and international box office, video sales, video rentals, TV and ancillary revenue are available through our research services. For more information, please contact us at research@the-numbers.com.