Labor Day (2014)
| Theatrical Performance | ||
| Domestic Box Office | $13,371,528 | Details |
| International Box Office | $818,282 | |
| Worldwide Box Office | $14,189,810 | |
| Domestic Physical Disc Sales | ||
| DVD Sales (estimated) | $3,682,250 | |
| Blu-ray Sales (estimated) | $2,019,351 | |
| Total | $5,701,601 | |
| OpusData ID: 147140100 More info... | ||
| Further financial details... | ||
Synopsis
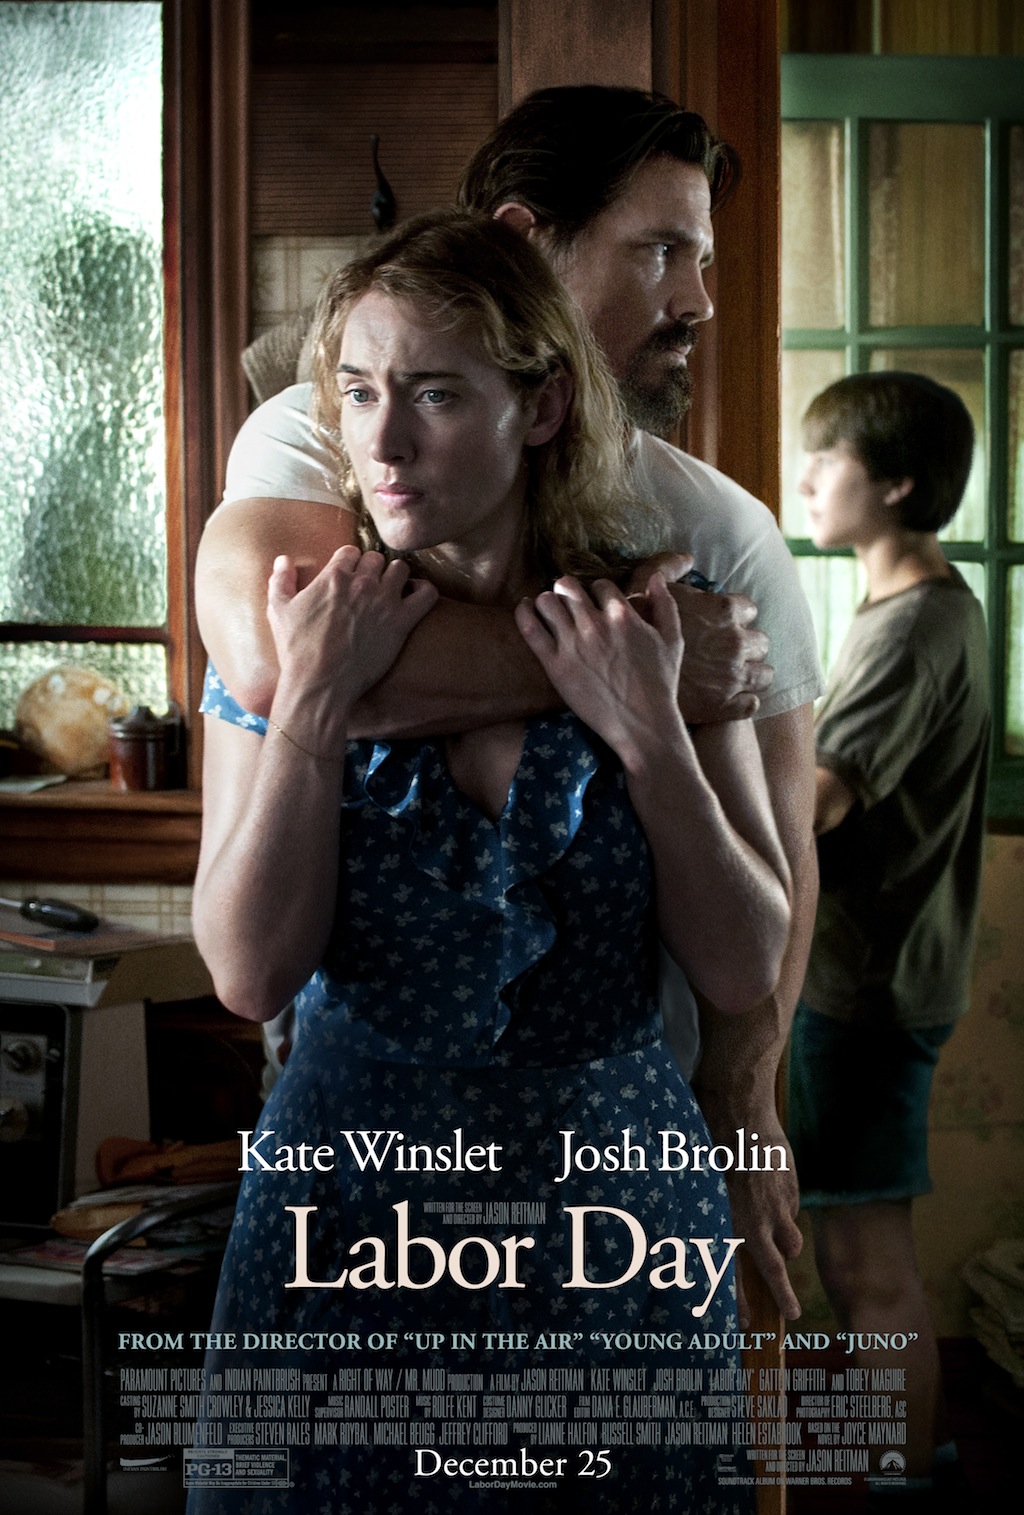
"Labor Day" centers on 13-year-old Henry Wheeler, who struggles to be the man of his house and care for his reclusive mother Adele while confronting all the pangs of adolescence. On a back-to-school shopping trip, Henry and his mother encounter Frank Chambers, a man both intimidating and clearly in need of help, who convinces them to take him into their home and later is revealed to be an escaped convict. The events of this long Labor Day weekend will shape them for the rest of their lives.
Metrics
| Opening Weekend: | $5,175,282 (38.7% of total gross) |
| Legs: | 2.58 (domestic box office/biggest weekend) |
| Domestic Share: | 94.2% (domestic box office/worldwide) |
| Production Budget: | $18,000,000 (worldwide box office is 0.8 times production budget) |
| Theater counts: | 2,584 opening theaters/2,584 max. theaters, 2.9 weeks average run per theater |
| Infl. Adj. Dom. BO | $19,574,478 |
Movie Details
| Domestic Releases: | January 31st, 2014 (Wide) by Paramount Pictures |
| International Releases: | March 13th, 2014 (Wide) (Brazil)
June 19th, 2014 (Wide) (Denmark) |
| Video Release: | April 29th, 2014 by Paramount Home Video |
| MPA Rating: | PG-13 for thematic material, brief violence and sexuality. (Rating bulletin 2284, 8/7/2013) |
| Running Time: | 111 minutes |
| Cast, crew, or production detail: | Voiceover/Narration |
| Plot point: | Accidental Death, Anxiety and Phobias, Coming of Age, Death of a Son or Daughter, Death of a Spouse or Fiancée / Fiancé, Depression, Fugitive / On the Run, Life on the Outside, Non-Chronological, Romance, Single Parent |
| Subgenre: | Life Drama |
| Source: | Based on Fiction Book/Short Story |
| Genre: | Drama |
| Production Method: | Live Action |
| Creative Type: | Contemporary Fiction |
| Production/Financing Companies: | Right of Way Films, Mr. Mudd |
| Production Countries: | United States |
| Languages: | English |
Weekend Box Office Performance
| Date | Rank | Gross | % Change | Theaters | Per Theater | Total Gross | Week |
|---|---|---|---|---|---|---|---|
| Jan 31, 2014 | 7 | $5,175,282 | 2,584 | $2,003 | $5,175,282 | 1 | |
| Feb 7, 2014 | 10 | $3,184,785 | -38% | 2,584 | $1,233 | $10,127,181 | 2 |
| Feb 14, 2014 | 17 | $1,250,675 | -61% | 1,664 | $752 | $12,445,243 | 3 |
| Feb 21, 2014 | 33 | $226,864 | -82% | 418 | $543 | $13,106,505 | 4 |
| Feb 28, 2014 | 48 | $47,776 | -79% | 107 | $447 | $13,250,522 | 5 |
| Mar 7, 2014 | 46 | $44,417 | -7% | 84 | $529 | $13,320,017 | 6 |
| Mar 14, 2014 | 62 | $14,971 | -66% | 42 | $356 | $13,362,308 | 7 |
Daily Box Office Performance
| Date | Rank | Gross | %YD | %LW | Theaters | Per Theater | Total Gross | Days |
|---|---|---|---|---|---|---|---|---|
| Jan 31, 2014 | 5 | $1,921,070 | 2,584 | $743 | $1,921,070 | 1 | ||
| Feb 1, 2014 | 7 | $2,398,137 | +25% | 2,584 | $928 | $4,319,207 | 2 | |
| Feb 2, 2014 | 6 | $856,075 | -64% | 2,584 | $331 | $5,175,282 | 3 | |
| Feb 3, 2014 | 6 | $400,100 | -53% | 2,584 | $155 | $5,575,382 | 4 | |
| Feb 4, 2014 | 5 | $570,324 | +43% | 2,584 | $221 | $6,145,706 | 5 | |
| Feb 5, 2014 | 6 | $389,525 | -32% | 2,584 | $151 | $6,535,231 | 6 | |
| Feb 6, 2014 | 6 | $407,165 | +5% | 2,584 | $158 | $6,942,396 | 7 | |
| Feb 7, 2014 | 9 | $904,787 | +122% | -53% | 2,584 | $350 | $7,847,183 | 8 |
| Feb 8, 2014 | 11 | $1,483,661 | +64% | -38% | 2,584 | $574 | $9,330,844 | 9 |
| Feb 9, 2014 | 10 | $796,337 | -46% | -7% | 2,584 | $308 | $10,127,181 | 10 |
| Feb 10, 2014 | 9 | $238,648 | -70% | -40% | 2,584 | $92 | $10,365,829 | 11 |
| Feb 11, 2014 | 7 | $342,594 | +44% | -40% | 2,584 | $133 | $10,708,423 | 12 |
| Feb 12, 2014 | 8 | $240,245 | -30% | -38% | 2,584 | $93 | $10,948,668 | 13 |
| Feb 13, 2014 | 9 | $245,900 | +2% | -40% | 2,584 | $95 | $11,194,568 | 14 |
| Feb 14, 2014 | 15 | $494,387 | +101% | -45% | 1,664 | $297 | $11,688,955 | 15 |
| Feb 15, 2014 | 17 | $454,362 | -8% | -69% | 1,664 | $273 | $12,143,317 | 16 |
| Feb 16, 2014 | 18 | $301,926 | -34% | -62% | 1,664 | $181 | $12,445,243 | 17 |
| Feb 17, 2014 | - | $159,969 | -47% | -33% | 1,664 | $96 | $12,605,212 | 18 |
| Feb 18, 2014 | 17 | $106,278 | -34% | -69% | 1,664 | $64 | $12,711,490 | 19 |
| Feb 19, 2014 | - | $83,230 | -22% | -65% | 1,664 | $50 | $12,794,720 | 20 |
| Feb 20, 2014 | - | $84,921 | +2% | -65% | 1,664 | $51 | $12,879,641 | 21 |
| Feb 21, 2014 | - | $69,301 | -18% | -86% | 418 | $166 | $12,948,942 | 22 |
| Feb 22, 2014 | - | $104,026 | +50% | -77% | 418 | $249 | $13,052,968 | 23 |
| Feb 23, 2014 | - | $53,537 | -49% | -82% | 418 | $128 | $13,106,505 | 24 |
| Feb 24, 2014 | - | $18,977 | -65% | -88% | 418 | $45 | $13,125,482 | 25 |
| Feb 25, 2014 | - | $29,490 | +55% | -72% | 418 | $71 | $13,154,972 | 26 |
| Feb 26, 2014 | - | $24,486 | -17% | -71% | 418 | $59 | $13,179,458 | 27 |
| Feb 27, 2014 | - | $23,288 | -5% | -73% | 418 | $56 | $13,202,746 | 28 |
| Feb 28, 2014 | - | $15,531 | -33% | -78% | 107 | $145 | $13,218,277 | 29 |
| Mar 1, 2014 | - | $21,388 | +38% | -79% | 107 | $200 | $13,239,665 | 30 |
| Mar 2, 2014 | - | $10,857 | -49% | -80% | 107 | $101 | $13,250,522 | 31 |
| Mar 3, 2014 | - | $4,535 | -58% | -76% | 107 | $42 | $13,255,057 | 32 |
| Mar 4, 2014 | - | $7,088 | +56% | -76% | 107 | $66 | $13,262,145 | 33 |
| Mar 5, 2014 | - | $6,006 | -15% | -75% | 107 | $56 | $13,268,151 | 34 |
| Mar 6, 2014 | - | $7,449 | +24% | -68% | 107 | $70 | $13,275,600 | 35 |
| Mar 7, 2014 | - | $13,767 | +85% | -11% | 84 | $164 | $13,289,367 | 36 |
| Mar 8, 2014 | - | $18,580 | +35% | -13% | 84 | $221 | $13,307,947 | 37 |
| Mar 9, 2014 | - | $12,070 | -35% | +11% | 84 | $144 | $13,320,017 | 38 |
| Mar 10, 2014 | - | $5,939 | -51% | +31% | 84 | $71 | $13,325,956 | 39 |
| Mar 11, 2014 | - | $7,350 | +24% | +4% | 84 | $88 | $13,333,306 | 40 |
| Mar 12, 2014 | - | $7,112 | -3% | +18% | 84 | $85 | $13,340,418 | 41 |
| Mar 13, 2014 | - | $6,919 | -3% | -7% | 84 | $82 | $13,347,337 | 42 |
| Mar 14, 2014 | - | $4,581 | -34% | -67% | 42 | $109 | $13,351,918 | 43 |
| Mar 15, 2014 | - | $6,278 | +37% | -66% | 42 | $149 | $13,358,196 | 44 |
| Mar 16, 2014 | - | $4,112 | -35% | -66% | 42 | $98 | $13,362,308 | 45 |
| Mar 17, 2014 | - | $2,277 | -45% | -62% | 42 | $54 | $13,364,585 | 46 |
| Mar 18, 2014 | - | $2,539 | +12% | -65% | 42 | $60 | $13,367,124 | 47 |
| Mar 19, 2014 | - | $1,725 | -32% | -76% | 42 | $41 | $13,368,849 | 48 |
| Mar 20, 2014 | - | $2,679 | +55% | -61% | 42 | $64 | $13,371,528 | 49 |
Weekly Box Office Performance
| Date | Rank | Gross | % Change | Theaters | Per Theater | Total Gross | Week |
|---|---|---|---|---|---|---|---|
| Jan 31, 2014 | 7 | $6,942,396 | 2,584 | $2,687 | $6,942,396 | 1 | |
| Feb 7, 2014 | 11 | $4,252,172 | -39% | 2,584 | $1,646 | $11,194,568 | 2 |
| Feb 14, 2014 | 17 | $1,685,073 | -60% | 1,664 | $1,013 | $12,879,641 | 3 |
| Feb 21, 2014 | 31 | $323,105 | -81% | 418 | $773 | $13,202,746 | 4 |
| Feb 28, 2014 | 45 | $72,854 | -77% | 107 | $681 | $13,275,600 | 5 |
| Mar 7, 2014 | 43 | $71,737 | -2% | 84 | $854 | $13,347,337 | 6 |
| Mar 14, 2014 | 57 | $24,191 | -66% | 42 | $576 | $13,371,528 | 7 |
Full financial estimates for this film, including domestic and international box office, video sales, video rentals, TV and ancillary revenue are available through our research services. For more information, please contact us at research@the-numbers.com.
Synopsis
"Labor Day" centers on 13-year-old Henry Wheeler, who struggles to be the man of his house and care for his reclusive mother Adele while confronting all the pangs of adolescence. On a back-to-school shopping trip, Henry and his mother encounter Frank Chambers, a man both intimidating and clearly in need of help, who convinces them to take him into their home and later is revealed to be an escaped convict. The events of this long Labor Day weekend will shape them for the rest of their lives.
Metrics
| Opening Weekend: | $5,175,282 (38.7% of total gross) |
| Legs: | 2.58 (domestic box office/biggest weekend) |
| Domestic Share: | 94.2% (domestic box office/worldwide) |
| Production Budget: | $18,000,000 (worldwide box office is 0.8 times production budget) |
| Theater counts: | 2,584 opening theaters/2,584 max. theaters, 2.9 weeks average run per theater |
| Infl. Adj. Dom. BO | $19,574,478 |
Movie Details
| Domestic Releases: | January 31st, 2014 (Wide) by Paramount Pictures |
| International Releases: | March 13th, 2014 (Wide) (Brazil)
June 19th, 2014 (Wide) (Denmark) |
| Video Release: | April 29th, 2014 by Paramount Home Video |
| MPA Rating: | PG-13 for thematic material, brief violence and sexuality. (Rating bulletin 2284, 8/7/2013) |
| Running Time: | 111 minutes |
| Cast, crew, or production detail: | Voiceover/Narration |
| Plot point: | Accidental Death, Anxiety and Phobias, Coming of Age, Death of a Son or Daughter, Death of a Spouse or Fiancée / Fiancé, Depression, Fugitive / On the Run, Life on the Outside, Non-Chronological, Romance, Single Parent |
| Subgenre: | Life Drama |
| Source: | Based on Fiction Book/Short Story |
| Genre: | Drama |
| Production Method: | Live Action |
| Creative Type: | Contemporary Fiction |
| Production/Financing Companies: | Right of Way Films, Mr. Mudd |
| Production Countries: | United States |
| Languages: | English |
Weekend Box Office Performance
| Date | Rank | Gross | % Change | Theaters | Per Theater | Total Gross | Week |
|---|---|---|---|---|---|---|---|
| Jan 31, 2014 | 7 | $5,175,282 | 2,584 | $2,003 | $5,175,282 | 1 | |
| Feb 7, 2014 | 10 | $3,184,785 | -38% | 2,584 | $1,233 | $10,127,181 | 2 |
| Feb 14, 2014 | 17 | $1,250,675 | -61% | 1,664 | $752 | $12,445,243 | 3 |
| Feb 21, 2014 | 33 | $226,864 | -82% | 418 | $543 | $13,106,505 | 4 |
| Feb 28, 2014 | 48 | $47,776 | -79% | 107 | $447 | $13,250,522 | 5 |
| Mar 7, 2014 | 46 | $44,417 | -7% | 84 | $529 | $13,320,017 | 6 |
| Mar 14, 2014 | 62 | $14,971 | -66% | 42 | $356 | $13,362,308 | 7 |
Daily Box Office Performance
| Date | Rank | Gross | %YD | %LW | Theaters | Per Theater | Total Gross | Days |
|---|---|---|---|---|---|---|---|---|
| Jan 31, 2014 | 5 | $1,921,070 | 2,584 | $743 | $1,921,070 | 1 | ||
| Feb 1, 2014 | 7 | $2,398,137 | +25% | 2,584 | $928 | $4,319,207 | 2 | |
| Feb 2, 2014 | 6 | $856,075 | -64% | 2,584 | $331 | $5,175,282 | 3 | |
| Feb 3, 2014 | 6 | $400,100 | -53% | 2,584 | $155 | $5,575,382 | 4 | |
| Feb 4, 2014 | 5 | $570,324 | +43% | 2,584 | $221 | $6,145,706 | 5 | |
| Feb 5, 2014 | 6 | $389,525 | -32% | 2,584 | $151 | $6,535,231 | 6 | |
| Feb 6, 2014 | 6 | $407,165 | +5% | 2,584 | $158 | $6,942,396 | 7 | |
| Feb 7, 2014 | 9 | $904,787 | +122% | -53% | 2,584 | $350 | $7,847,183 | 8 |
| Feb 8, 2014 | 11 | $1,483,661 | +64% | -38% | 2,584 | $574 | $9,330,844 | 9 |
| Feb 9, 2014 | 10 | $796,337 | -46% | -7% | 2,584 | $308 | $10,127,181 | 10 |
| Feb 10, 2014 | 9 | $238,648 | -70% | -40% | 2,584 | $92 | $10,365,829 | 11 |
| Feb 11, 2014 | 7 | $342,594 | +44% | -40% | 2,584 | $133 | $10,708,423 | 12 |
| Feb 12, 2014 | 8 | $240,245 | -30% | -38% | 2,584 | $93 | $10,948,668 | 13 |
| Feb 13, 2014 | 9 | $245,900 | +2% | -40% | 2,584 | $95 | $11,194,568 | 14 |
| Feb 14, 2014 | 15 | $494,387 | +101% | -45% | 1,664 | $297 | $11,688,955 | 15 |
| Feb 15, 2014 | 17 | $454,362 | -8% | -69% | 1,664 | $273 | $12,143,317 | 16 |
| Feb 16, 2014 | 18 | $301,926 | -34% | -62% | 1,664 | $181 | $12,445,243 | 17 |
| Feb 17, 2014 | - | $159,969 | -47% | -33% | 1,664 | $96 | $12,605,212 | 18 |
| Feb 18, 2014 | 17 | $106,278 | -34% | -69% | 1,664 | $64 | $12,711,490 | 19 |
| Feb 19, 2014 | - | $83,230 | -22% | -65% | 1,664 | $50 | $12,794,720 | 20 |
| Feb 20, 2014 | - | $84,921 | +2% | -65% | 1,664 | $51 | $12,879,641 | 21 |
| Feb 21, 2014 | - | $69,301 | -18% | -86% | 418 | $166 | $12,948,942 | 22 |
| Feb 22, 2014 | - | $104,026 | +50% | -77% | 418 | $249 | $13,052,968 | 23 |
| Feb 23, 2014 | - | $53,537 | -49% | -82% | 418 | $128 | $13,106,505 | 24 |
| Feb 24, 2014 | - | $18,977 | -65% | -88% | 418 | $45 | $13,125,482 | 25 |
| Feb 25, 2014 | - | $29,490 | +55% | -72% | 418 | $71 | $13,154,972 | 26 |
| Feb 26, 2014 | - | $24,486 | -17% | -71% | 418 | $59 | $13,179,458 | 27 |
| Feb 27, 2014 | - | $23,288 | -5% | -73% | 418 | $56 | $13,202,746 | 28 |
| Feb 28, 2014 | - | $15,531 | -33% | -78% | 107 | $145 | $13,218,277 | 29 |
| Mar 1, 2014 | - | $21,388 | +38% | -79% | 107 | $200 | $13,239,665 | 30 |
| Mar 2, 2014 | - | $10,857 | -49% | -80% | 107 | $101 | $13,250,522 | 31 |
| Mar 3, 2014 | - | $4,535 | -58% | -76% | 107 | $42 | $13,255,057 | 32 |
| Mar 4, 2014 | - | $7,088 | +56% | -76% | 107 | $66 | $13,262,145 | 33 |
| Mar 5, 2014 | - | $6,006 | -15% | -75% | 107 | $56 | $13,268,151 | 34 |
| Mar 6, 2014 | - | $7,449 | +24% | -68% | 107 | $70 | $13,275,600 | 35 |
| Mar 7, 2014 | - | $13,767 | +85% | -11% | 84 | $164 | $13,289,367 | 36 |
| Mar 8, 2014 | - | $18,580 | +35% | -13% | 84 | $221 | $13,307,947 | 37 |
| Mar 9, 2014 | - | $12,070 | -35% | +11% | 84 | $144 | $13,320,017 | 38 |
| Mar 10, 2014 | - | $5,939 | -51% | +31% | 84 | $71 | $13,325,956 | 39 |
| Mar 11, 2014 | - | $7,350 | +24% | +4% | 84 | $88 | $13,333,306 | 40 |
| Mar 12, 2014 | - | $7,112 | -3% | +18% | 84 | $85 | $13,340,418 | 41 |
| Mar 13, 2014 | - | $6,919 | -3% | -7% | 84 | $82 | $13,347,337 | 42 |
| Mar 14, 2014 | - | $4,581 | -34% | -67% | 42 | $109 | $13,351,918 | 43 |
| Mar 15, 2014 | - | $6,278 | +37% | -66% | 42 | $149 | $13,358,196 | 44 |
| Mar 16, 2014 | - | $4,112 | -35% | -66% | 42 | $98 | $13,362,308 | 45 |
| Mar 17, 2014 | - | $2,277 | -45% | -62% | 42 | $54 | $13,364,585 | 46 |
| Mar 18, 2014 | - | $2,539 | +12% | -65% | 42 | $60 | $13,367,124 | 47 |
| Mar 19, 2014 | - | $1,725 | -32% | -76% | 42 | $41 | $13,368,849 | 48 |
| Mar 20, 2014 | - | $2,679 | +55% | -61% | 42 | $64 | $13,371,528 | 49 |
Weekly Box Office Performance
| Date | Rank | Gross | % Change | Theaters | Per Theater | Total Gross | Week |
|---|---|---|---|---|---|---|---|
| Jan 31, 2014 | 7 | $6,942,396 | 2,584 | $2,687 | $6,942,396 | 1 | |
| Feb 7, 2014 | 11 | $4,252,172 | -39% | 2,584 | $1,646 | $11,194,568 | 2 |
| Feb 14, 2014 | 17 | $1,685,073 | -60% | 1,664 | $1,013 | $12,879,641 | 3 |
| Feb 21, 2014 | 31 | $323,105 | -81% | 418 | $773 | $13,202,746 | 4 |
| Feb 28, 2014 | 45 | $72,854 | -77% | 107 | $681 | $13,275,600 | 5 |
| Mar 7, 2014 | 43 | $71,737 | -2% | 84 | $854 | $13,347,337 | 6 |
| Mar 14, 2014 | 57 | $24,191 | -66% | 42 | $576 | $13,371,528 | 7 |
Full financial estimates for this film, including domestic and international box office, video sales, video rentals, TV and ancillary revenue are available through our research services. For more information, please contact us at research@the-numbers.com.