Legal Eagles (1986)
| Theatrical Performance | ||
| Domestic Box Office | $49,851,591 | Details |
| OpusData ID: 11130100 More info... | ||
| Further financial details... | ||
Synopsis
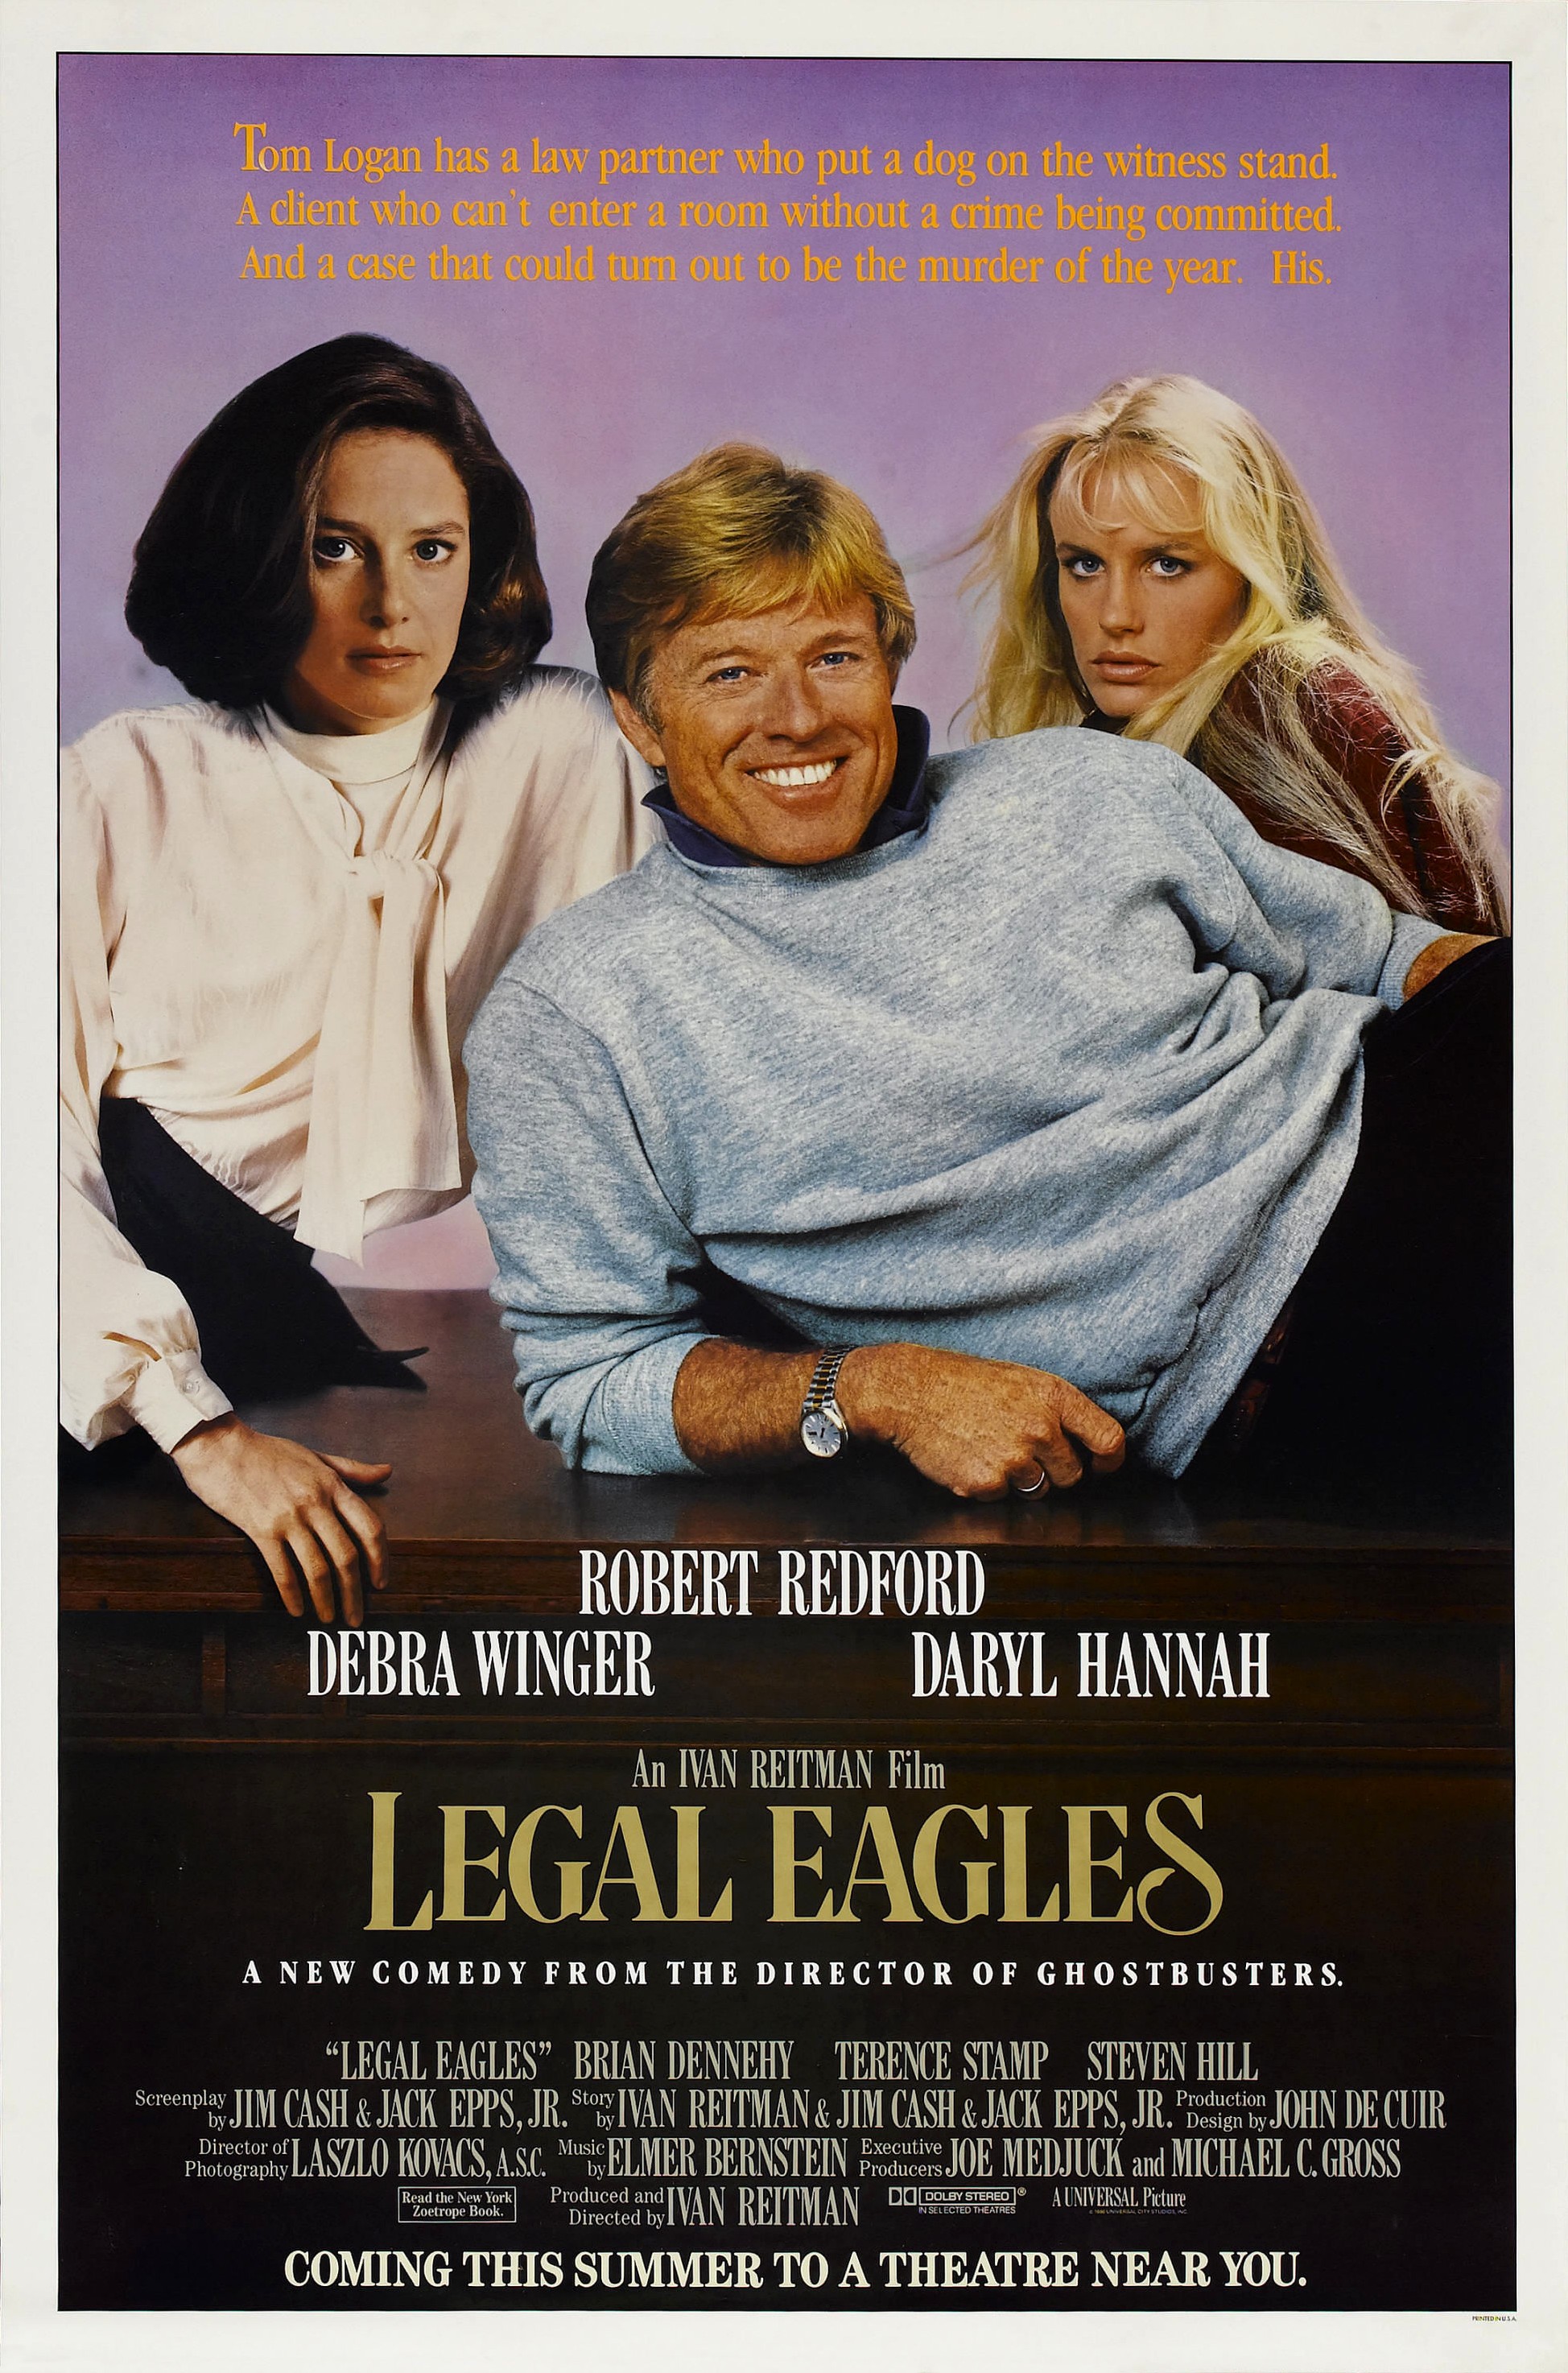
A hard-nosed assistant district attorney and an imaginative defense attorney combine their talents to defend a spacey “performance artist” who is accused of theft and murder. The clashing attorneys get more than they bargained for as they come in contact with New York’s fascinating art world and dangerous underworld.
Metrics
| Opening Weekend: | $8,132,378 (16.3% of total gross) |
| Legs: | 6.13 (domestic box office/biggest weekend) |
| Domestic Share: | 100.0% (domestic box office/worldwide) |
| Production Budget: | $40,000,000 (worldwide box office is 1.2 times production budget) |
| Theater counts: | 1,248 opening theaters/1,248 max. theaters, 6.1 weeks average run per theater |
| Infl. Adj. Dom. BO | $151,973,443 |
Movie Details
| Domestic Releases: | June 18th, 1986 (Wide) by Universal |
| Video Release: | March 1st, 1992 by Universal Home Entertainment |
| MPA Rating: | PG |
| Running Time: | 116 minutes |
| Plot point: | False Identity, Hitmen, Lawyers, No Honor Among Thieves, Romance, White Collar Crime, Young Child Dealing with the Death of a Parent |
| Subgenre: | Crime Comedy |
| Source: | Based on Fiction Book/Short Story |
| Genre: | Comedy |
| Production Method: | Live Action |
| Creative Type: | Contemporary Fiction |
| Production/Financing Companies: | Northern Lights Films |
| Production Countries: | United States |
| Languages: | English |
Weekend Box Office Performance
| Date | Rank | Gross | % Change | Theaters | Per Theater | Total Gross | Week |
|---|---|---|---|---|---|---|---|
| Jun 20, 1986 | 2 | $8,132,378 | 1,248 | $6,516 | $8,221,396 | 1 | |
| Jun 27, 1986 | 3 | $6,022,848 | -26% | 1,248 | $4,826 | $18,448,346 | 2 |
| Jul 4, 1986 | 5 | $4,357,740 | -28% | 1,231 | $3,540 | $26,121,736 | 3 |
| Jul 11, 1986 | 7 | $3,931,560 | -10% | 1,206 | $3,260 | $32,403,688 | 4 |
| Jul 18, 1986 | 8 | $2,715,750 | -31% | 1,065 | $2,550 | $36,911,873 | 5 |
| Aug 8, 1986 | 17 | $1,004,813 | 640 | $1,570 | $43,913,620 | 8 | |
| Aug 15, 1986 | 20 | $755,173 | -25% | 547 | $1,381 | $45,246,764 | 9 |
| Aug 22, 1986 | 20 | $510,600 | -32% | 460 | $1,110 | $46,210,024 | 10 |
Weekly Box Office Performance
| Date | Rank | Gross | % Change | Theaters | Per Theater | Total Gross | Week |
|---|---|---|---|---|---|---|---|
| Jun 20, 1986 | 3 | $12,336,480 | 1,248 | $9,885 | $12,425,498 | 2 | |
| Jun 27, 1986 | 3 | $9,338,498 | -24% | 1,248 | $7,483 | $21,763,996 | 3 |
| Jul 4, 1986 | 5 | $6,708,132 | -28% | 1,231 | $5,449 | $28,472,128 | 4 |
| Jul 11, 1986 | 7 | $5,723,995 | -15% | 1,206 | $4,746 | $34,196,123 | 5 |
| Aug 8, 1986 | 17 | $1,582,784 | 640 | $2,473 | $44,491,591 | 9 | |
| Aug 15, 1986 | 19 | $1,207,833 | -24% | 547 | $2,208 | $45,699,424 | 10 |
Synopsis
A hard-nosed assistant district attorney and an imaginative defense attorney combine their talents to defend a spacey “performance artist” who is accused of theft and murder. The clashing attorneys get more than they bargained for as they come in contact with New York’s fascinating art world and dangerous underworld.
Metrics
| Opening Weekend: | $8,132,378 (16.3% of total gross) |
| Legs: | 6.13 (domestic box office/biggest weekend) |
| Domestic Share: | 100.0% (domestic box office/worldwide) |
| Production Budget: | $40,000,000 (worldwide box office is 1.2 times production budget) |
| Theater counts: | 1,248 opening theaters/1,248 max. theaters, 6.1 weeks average run per theater |
| Infl. Adj. Dom. BO | $151,973,443 |
Movie Details
| Domestic Releases: | June 18th, 1986 (Wide) by Universal |
| Video Release: | March 1st, 1992 by Universal Home Entertainment |
| MPA Rating: | PG |
| Running Time: | 116 minutes |
| Plot point: | False Identity, Hitmen, Lawyers, No Honor Among Thieves, Romance, White Collar Crime, Young Child Dealing with the Death of a Parent |
| Subgenre: | Crime Comedy |
| Source: | Based on Fiction Book/Short Story |
| Genre: | Comedy |
| Production Method: | Live Action |
| Creative Type: | Contemporary Fiction |
| Production/Financing Companies: | Northern Lights Films |
| Production Countries: | United States |
| Languages: | English |
Weekend Box Office Performance
| Date | Rank | Gross | % Change | Theaters | Per Theater | Total Gross | Week |
|---|---|---|---|---|---|---|---|
| Jun 20, 1986 | 2 | $8,132,378 | 1,248 | $6,516 | $8,221,396 | 1 | |
| Jun 27, 1986 | 3 | $6,022,848 | -26% | 1,248 | $4,826 | $18,448,346 | 2 |
| Jul 4, 1986 | 5 | $4,357,740 | -28% | 1,231 | $3,540 | $26,121,736 | 3 |
| Jul 11, 1986 | 7 | $3,931,560 | -10% | 1,206 | $3,260 | $32,403,688 | 4 |
| Jul 18, 1986 | 8 | $2,715,750 | -31% | 1,065 | $2,550 | $36,911,873 | 5 |
| Aug 8, 1986 | 17 | $1,004,813 | 640 | $1,570 | $43,913,620 | 8 | |
| Aug 15, 1986 | 20 | $755,173 | -25% | 547 | $1,381 | $45,246,764 | 9 |
| Aug 22, 1986 | 20 | $510,600 | -32% | 460 | $1,110 | $46,210,024 | 10 |
Weekly Box Office Performance
| Date | Rank | Gross | % Change | Theaters | Per Theater | Total Gross | Week |
|---|---|---|---|---|---|---|---|
| Jun 20, 1986 | 3 | $12,336,480 | 1,248 | $9,885 | $12,425,498 | 2 | |
| Jun 27, 1986 | 3 | $9,338,498 | -24% | 1,248 | $7,483 | $21,763,996 | 3 |
| Jul 4, 1986 | 5 | $6,708,132 | -28% | 1,231 | $5,449 | $28,472,128 | 4 |
| Jul 11, 1986 | 7 | $5,723,995 | -15% | 1,206 | $4,746 | $34,196,123 | 5 |
| Aug 8, 1986 | 17 | $1,582,784 | 640 | $2,473 | $44,491,591 | 9 | |
| Aug 15, 1986 | 19 | $1,207,833 | -24% | 547 | $2,208 | $45,699,424 | 10 |