Made in Dagenham (2010)
| Theatrical Performance | ||
| Domestic Box Office | $1,095,369 | Details |
| International Box Office | $14,548,827 | Details |
| Worldwide Box Office | $15,644,196 | |
| OpusData ID: 139500100 More info... | ||
| Further financial details... | ||
Synopsis
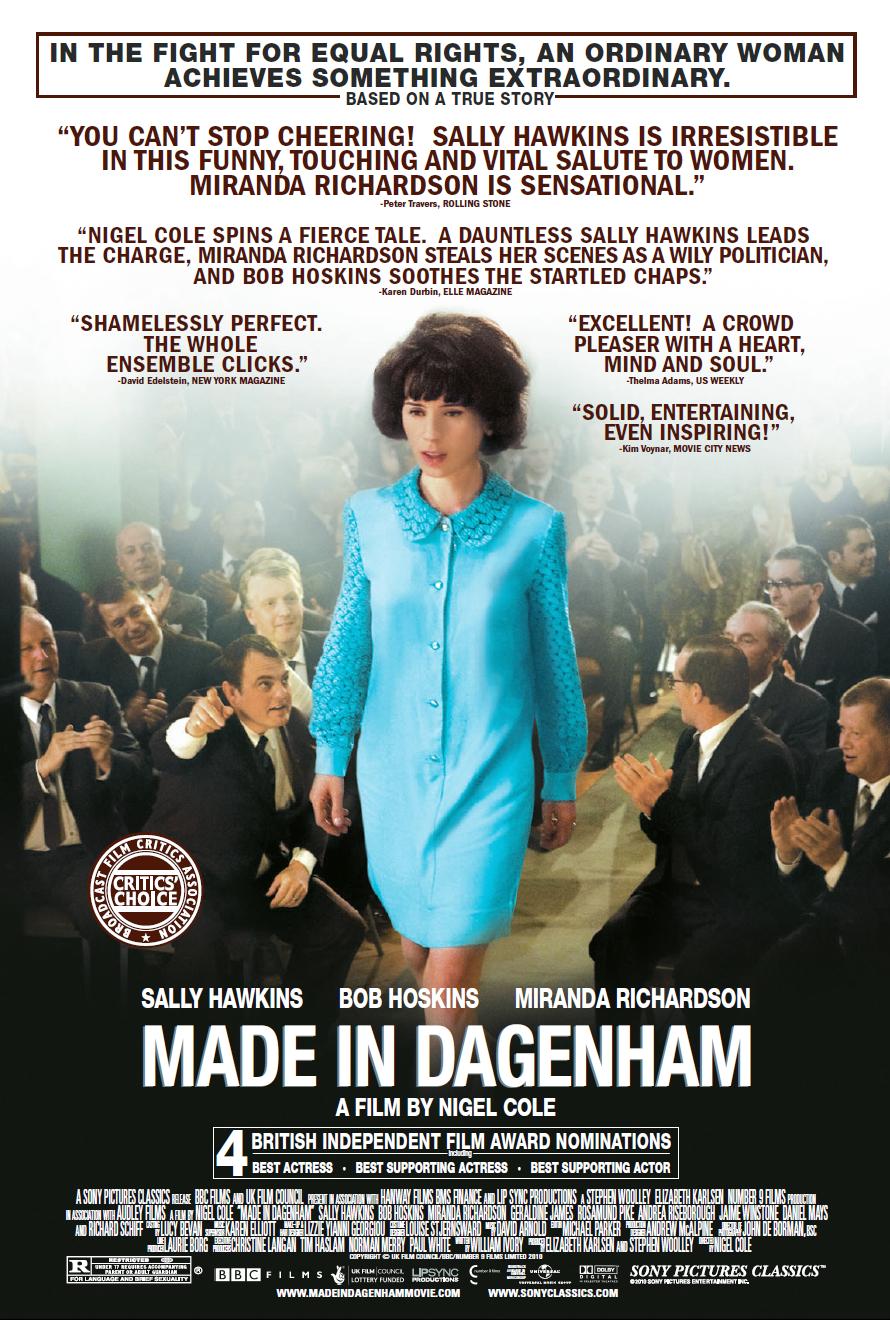
Based on a true story, Made in Dagenham portrays a decisive moment in that decade of upheaval, when the fight for equal rights and pay was led - unexpectedly - by ordinary working-class women with one foot in the kitchen, one foot on the factory floor, and ears glued to the pop coming over the radio and telly from far-off London (19 kilometers and a world away).
Metrics
| Opening Weekend: | $37,563 (3.4% of total gross) |
| Legs: | 11.48 (domestic box office/biggest weekend) |
| Domestic Share: | 7.0% (domestic box office/worldwide) |
| Production Budget: | $8,000,000 (worldwide box office is 2.0 times production budget) |
| Theater counts: | 3 opening theaters/89 max. theaters, 6.6 weeks average run per theater |
| Infl. Adj. Dom. BO | $1,615,227 |
Movie Details
| Domestic Releases: | November 19th, 2010 (Limited) by Sony Pictures Classics |
| International Releases: | January 14th, 2011 (Wide) (Germany) |
| MPA Rating: | R for language and brief sexuality. (Rating bulletin 2136, 9/1/2010) |
| Running Time: | 113 minutes |
| Plot point: | Bigotry, Descrimination, Political, Strike |
| Source: | Based on Real Life Events |
| Genre: | Drama |
| Production Method: | Live Action |
| Creative Type: | Dramatization |
| Production/Financing Companies: | Lipsync Productions, BMS Finance, UKFC, Audley Films, BBC Films, Number 9 Films |
| Production Countries: | United Kingdom |
| Languages: | English |
Weekend Box Office Performance
| Date | Rank | Gross | % Change | Theaters | Per Theater | Total Gross | Week |
|---|---|---|---|---|---|---|---|
| Nov 19, 2010 | 38 | $37,563 | 3 | $12,521 | $37,563 | 1 | |
| Nov 26, 2010 | 40 | $62,316 | +66% | 11 | $5,665 | $122,741 | 2 |
| Dec 3, 2010 | 42 | $37,275 | -40% | 11 | $3,389 | $181,232 | 3 |
| Dec 10, 2010 | 48 | $21,256 | -43% | 15 | $1,417 | $217,826 | 4 |
| Dec 17, 2010 | 40 | $41,534 | +95% | 31 | $1,340 | $268,609 | 5 |
| Dec 24, 2010 | 40 | $35,335 | -15% | 37 | $955 | $330,701 | 6 |
| Dec 31, 2010 | 34 | $95,385 | +170% | 54 | $1,766 | $492,379 | 7 |
| Jan 7, 2011 | 36 | $86,685 | -9% | 60 | $1,445 | $626,684 | 8 |
| Jan 14, 2011 | 37 | $93,623 | +8% | 89 | $1,052 | $758,345 | 9 |
| Jan 21, 2011 | 40 | $73,205 | -22% | 86 | $851 | $887,185 | 10 |
| Jan 28, 2011 | 48 | $26,661 | -64% | 42 | $635 | $943,426 | 11 |
| Feb 4, 2011 | 50 | $17,617 | -34% | 41 | $430 | $968,584 | 12 |
| Feb 11, 2011 | 52 | $18,308 | +4% | 29 | $631 | $997,735 | 13 |
| Feb 18, 2011 | 66 | $8,906 | -51% | 15 | $594 | $1,017,246 | 14 |
| Feb 25, 2011 | 76 | $4,562 | -49% | 10 | $456 | $1,031,140 | 15 |
| Mar 4, 2011 | 83 | $4,954 | +9% | 6 | $826 | $1,043,699 | 16 |
| Mar 11, 2011 | 106 | $1,028 | -79% | 7 | $147 | $1,052,115 | 17 |
| Mar 18, 2011 | 71 | $12,562 | +1,122% | 16 | $785 | $1,066,222 | 18 |
| Mar 25, 2011 | 78 | $9,428 | -25% | 12 | $786 | $1,083,520 | 19 |
| Apr 1, 2011 | 92 | $4,083 | -57% | 5 | $817 | $1,091,901 | 20 |
| Apr 8, 2011 | 106 | $1,052 | -74% | 5 | $210 | $1,094,798 | 21 |
Daily Box Office Performance
| Date | Rank | Gross | %YD | %LW | Theaters | Per Theater | Total Gross | Days |
|---|---|---|---|---|---|---|---|---|
| Jan 17, 2011 | 33 | $28,000 | 89 | $315 | $786,345 | 60 | ||
| Feb 21, 2011 | 67 | $1,556 | 15 | $104 | $1,018,802 | 95 |
Weekly Box Office Performance
| Date | Rank | Gross | % Change | Theaters | Per Theater | Total Gross | Week |
|---|---|---|---|---|---|---|---|
| Nov 19, 2010 | 44 | $60,425 | 3 | $20,142 | $60,425 | 1 | |
| Nov 26, 2010 | 41 | $83,532 | +38% | 11 | $7,594 | $143,957 | 2 |
| Dec 3, 2010 | 43 | $52,613 | -37% | 11 | $4,783 | $196,570 | 3 |
| Dec 10, 2010 | 49 | $30,505 | -42% | 15 | $2,034 | $227,075 | 4 |
| Dec 17, 2010 | 46 | $68,291 | +124% | 31 | $2,203 | $295,366 | 5 |
| Dec 24, 2010 | 37 | $101,628 | +49% | 37 | $2,747 | $396,994 | 6 |
| Dec 31, 2010 | 31 | $143,005 | +41% | 54 | $2,648 | $539,999 | 7 |
| Jan 7, 2011 | 35 | $124,723 | -13% | 60 | $2,079 | $664,722 | 8 |
| Jan 14, 2011 | 36 | $149,258 | +20% | 89 | $1,677 | $813,980 | 9 |
| Jan 21, 2011 | 40 | $102,785 | -31% | 86 | $1,195 | $916,765 | 10 |
| Jan 28, 2011 | 49 | $34,202 | -67% | 42 | $814 | $950,967 | 11 |
| Feb 4, 2011 | 49 | $28,460 | -17% | 41 | $694 | $979,427 | 12 |
| Feb 11, 2011 | 50 | $28,913 | +2% | 29 | $997 | $1,008,340 | 13 |
| Feb 18, 2011 | 61 | $18,238 | -37% | 15 | $1,216 | $1,026,578 | 14 |
| Feb 25, 2011 | 68 | $12,167 | -33% | 10 | $1,217 | $1,038,745 | 15 |
| Mar 4, 2011 | 71 | $12,342 | +1% | 6 | $2,057 | $1,051,087 | 16 |
| Mar 11, 2011 | 102 | $2,573 | -79% | 7 | $368 | $1,053,660 | 17 |
| Mar 18, 2011 | 70 | $20,432 | +694% | 16 | $1,277 | $1,074,092 | 18 |
| Mar 25, 2011 | 81 | $13,726 | -33% | 12 | $1,144 | $1,087,818 | 19 |
| Apr 1, 2011 | 96 | $5,928 | -57% | 5 | $1,186 | $1,093,746 | 20 |
| Apr 8, 2011 | 106 | $1,623 | -73% | 5 | $325 | $1,095,369 | 21 |
Top International Territories
Box Office Summary Per Territory
| Territory | Release Date |
Opening Weekend |
Opening Weekend Screens/Theaters |
Maximum Screens/Theaters |
Theatrical Engagements |
Total Box Office |
Report Date |
|||
|---|---|---|---|---|---|---|---|---|---|---|
| Germany | 1/14/2011 | $0 | 0 | 0 | 0 | $844,670 | 9/26/2018 | |||
| Rest of World | $13,704,157 | |||||||||
| International Total | $14,548,827 | 9/26/2018 | ||||||||
Note: Territories vary in whether they report screens or theaters. Full details on international box office data are available via our OpusData service.
Lead Ensemble Member
| Sally Hawkins | Rita O'Grady | |
| Bob Hoskins | Albert | |
| Miranda Richardson | Secretary of State Barbara Castle | |
| Geraldine James | Connie | |
| Rosamund Pike | Lisa | |
| Andrea Riseborough | Brenda | |
| Daniel Mays | Eddie O'Grady | |
| Jaime Winstone | Sandra |
Production and Technical Credits
| Nigel Cole | Director | |
| William Ivory | Screenwriter | |
| Stephen Woolley | Producer | |
| Elizabeth Karlsen | Producer | |
| John de Borman | Cinematographer | |
| Andrew McAlpine | Production Designer | |
| Michael Parker | Editor | |
| David Arnold | Composer |
Cast and crew with above-the-line roles are marked in bold. The line marks the division between above-the-line and below-the-line roles.
Full financial estimates for this film, including domestic and international box office, video sales, video rentals, TV and ancillary revenue are available through our research services. For more information, please contact us at research@the-numbers.com.
Synopsis
Based on a true story, Made in Dagenham portrays a decisive moment in that decade of upheaval, when the fight for equal rights and pay was led - unexpectedly - by ordinary working-class women with one foot in the kitchen, one foot on the factory floor, and ears glued to the pop coming over the radio and telly from far-off London (19 kilometers and a world away).
Metrics
| Opening Weekend: | $37,563 (3.4% of total gross) |
| Legs: | 11.48 (domestic box office/biggest weekend) |
| Domestic Share: | 7.0% (domestic box office/worldwide) |
| Production Budget: | $8,000,000 (worldwide box office is 2.0 times production budget) |
| Theater counts: | 3 opening theaters/89 max. theaters, 6.6 weeks average run per theater |
| Infl. Adj. Dom. BO | $1,615,227 |
Movie Details
| Domestic Releases: | November 19th, 2010 (Limited) by Sony Pictures Classics |
| International Releases: | January 14th, 2011 (Wide) (Germany) |
| MPA Rating: | R for language and brief sexuality. (Rating bulletin 2136, 9/1/2010) |
| Running Time: | 113 minutes |
| Plot point: | Bigotry, Descrimination, Political, Strike |
| Source: | Based on Real Life Events |
| Genre: | Drama |
| Production Method: | Live Action |
| Creative Type: | Dramatization |
| Production/Financing Companies: | Lipsync Productions, BMS Finance, UKFC, Audley Films, BBC Films, Number 9 Films |
| Production Countries: | United Kingdom |
| Languages: | English |
Weekend Box Office Performance
| Date | Rank | Gross | % Change | Theaters | Per Theater | Total Gross | Week |
|---|---|---|---|---|---|---|---|
| Nov 19, 2010 | 38 | $37,563 | 3 | $12,521 | $37,563 | 1 | |
| Nov 26, 2010 | 40 | $62,316 | +66% | 11 | $5,665 | $122,741 | 2 |
| Dec 3, 2010 | 42 | $37,275 | -40% | 11 | $3,389 | $181,232 | 3 |
| Dec 10, 2010 | 48 | $21,256 | -43% | 15 | $1,417 | $217,826 | 4 |
| Dec 17, 2010 | 40 | $41,534 | +95% | 31 | $1,340 | $268,609 | 5 |
| Dec 24, 2010 | 40 | $35,335 | -15% | 37 | $955 | $330,701 | 6 |
| Dec 31, 2010 | 34 | $95,385 | +170% | 54 | $1,766 | $492,379 | 7 |
| Jan 7, 2011 | 36 | $86,685 | -9% | 60 | $1,445 | $626,684 | 8 |
| Jan 14, 2011 | 37 | $93,623 | +8% | 89 | $1,052 | $758,345 | 9 |
| Jan 21, 2011 | 40 | $73,205 | -22% | 86 | $851 | $887,185 | 10 |
| Jan 28, 2011 | 48 | $26,661 | -64% | 42 | $635 | $943,426 | 11 |
| Feb 4, 2011 | 50 | $17,617 | -34% | 41 | $430 | $968,584 | 12 |
| Feb 11, 2011 | 52 | $18,308 | +4% | 29 | $631 | $997,735 | 13 |
| Feb 18, 2011 | 66 | $8,906 | -51% | 15 | $594 | $1,017,246 | 14 |
| Feb 25, 2011 | 76 | $4,562 | -49% | 10 | $456 | $1,031,140 | 15 |
| Mar 4, 2011 | 83 | $4,954 | +9% | 6 | $826 | $1,043,699 | 16 |
| Mar 11, 2011 | 106 | $1,028 | -79% | 7 | $147 | $1,052,115 | 17 |
| Mar 18, 2011 | 71 | $12,562 | +1,122% | 16 | $785 | $1,066,222 | 18 |
| Mar 25, 2011 | 78 | $9,428 | -25% | 12 | $786 | $1,083,520 | 19 |
| Apr 1, 2011 | 92 | $4,083 | -57% | 5 | $817 | $1,091,901 | 20 |
| Apr 8, 2011 | 106 | $1,052 | -74% | 5 | $210 | $1,094,798 | 21 |
Daily Box Office Performance
| Date | Rank | Gross | %YD | %LW | Theaters | Per Theater | Total Gross | Days |
|---|---|---|---|---|---|---|---|---|
| Jan 17, 2011 | 33 | $28,000 | 89 | $315 | $786,345 | 60 | ||
| Feb 21, 2011 | 67 | $1,556 | 15 | $104 | $1,018,802 | 95 |
Weekly Box Office Performance
| Date | Rank | Gross | % Change | Theaters | Per Theater | Total Gross | Week |
|---|---|---|---|---|---|---|---|
| Nov 19, 2010 | 44 | $60,425 | 3 | $20,142 | $60,425 | 1 | |
| Nov 26, 2010 | 41 | $83,532 | +38% | 11 | $7,594 | $143,957 | 2 |
| Dec 3, 2010 | 43 | $52,613 | -37% | 11 | $4,783 | $196,570 | 3 |
| Dec 10, 2010 | 49 | $30,505 | -42% | 15 | $2,034 | $227,075 | 4 |
| Dec 17, 2010 | 46 | $68,291 | +124% | 31 | $2,203 | $295,366 | 5 |
| Dec 24, 2010 | 37 | $101,628 | +49% | 37 | $2,747 | $396,994 | 6 |
| Dec 31, 2010 | 31 | $143,005 | +41% | 54 | $2,648 | $539,999 | 7 |
| Jan 7, 2011 | 35 | $124,723 | -13% | 60 | $2,079 | $664,722 | 8 |
| Jan 14, 2011 | 36 | $149,258 | +20% | 89 | $1,677 | $813,980 | 9 |
| Jan 21, 2011 | 40 | $102,785 | -31% | 86 | $1,195 | $916,765 | 10 |
| Jan 28, 2011 | 49 | $34,202 | -67% | 42 | $814 | $950,967 | 11 |
| Feb 4, 2011 | 49 | $28,460 | -17% | 41 | $694 | $979,427 | 12 |
| Feb 11, 2011 | 50 | $28,913 | +2% | 29 | $997 | $1,008,340 | 13 |
| Feb 18, 2011 | 61 | $18,238 | -37% | 15 | $1,216 | $1,026,578 | 14 |
| Feb 25, 2011 | 68 | $12,167 | -33% | 10 | $1,217 | $1,038,745 | 15 |
| Mar 4, 2011 | 71 | $12,342 | +1% | 6 | $2,057 | $1,051,087 | 16 |
| Mar 11, 2011 | 102 | $2,573 | -79% | 7 | $368 | $1,053,660 | 17 |
| Mar 18, 2011 | 70 | $20,432 | +694% | 16 | $1,277 | $1,074,092 | 18 |
| Mar 25, 2011 | 81 | $13,726 | -33% | 12 | $1,144 | $1,087,818 | 19 |
| Apr 1, 2011 | 96 | $5,928 | -57% | 5 | $1,186 | $1,093,746 | 20 |
| Apr 8, 2011 | 106 | $1,623 | -73% | 5 | $325 | $1,095,369 | 21 |
Top International Territories
Box Office Summary Per Territory
| Territory | Release Date |
Opening Weekend |
Opening Weekend Screens/Theaters |
Maximum Screens/Theaters |
Theatrical Engagements |
Total Box Office |
Report Date |
|||
|---|---|---|---|---|---|---|---|---|---|---|
| Germany | 1/14/2011 | $0 | 0 | 0 | 0 | $844,670 | 9/26/2018 | |||
| Rest of World | $13,704,157 | |||||||||
| International Total | $14,548,827 | 9/26/2018 | ||||||||
Note: Territories vary in whether they report screens or theaters. Full details on international box office data are available via our OpusData service.
Lead Ensemble Member
| Sally Hawkins | Rita O'Grady | |
| Bob Hoskins | Albert | |
| Miranda Richardson | Secretary of State Barbara Castle | |
| Geraldine James | Connie | |
| Rosamund Pike | Lisa | |
| Andrea Riseborough | Brenda | |
| Daniel Mays | Eddie O'Grady | |
| Jaime Winstone | Sandra |
Production and Technical Credits
| Nigel Cole | Director | |
| William Ivory | Screenwriter | |
| Stephen Woolley | Producer | |
| Elizabeth Karlsen | Producer | |
| John de Borman | Cinematographer | |
| Andrew McAlpine | Production Designer | |
| Michael Parker | Editor | |
| David Arnold | Composer |
Cast and crew with above-the-line roles are marked in bold. The line marks the division between above-the-line and below-the-line roles.
Full financial estimates for this film, including domestic and international box office, video sales, video rentals, TV and ancillary revenue are available through our research services. For more information, please contact us at research@the-numbers.com.