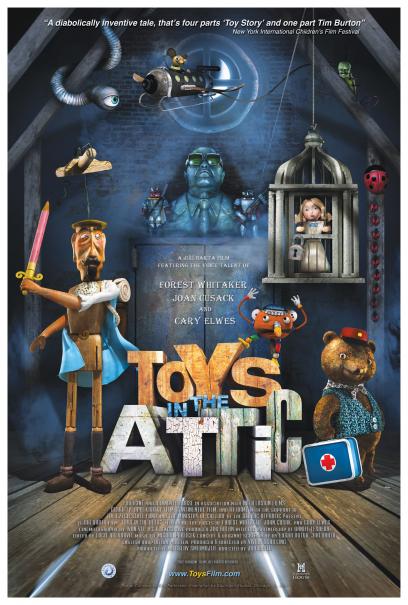
Na pude (2012)
| Theatrical Performance | ||
| Domestic Box Office | $64,918 | Details |
| OpusData ID: 179380100 More info... | ||
| Further financial details... | ||
Synopsis
The world of the attic is divided into the land of happy toys in the West and the Land of Evil in the East. The despotic Head of State rules over the Land of Evil with a band of sinister minions, insects and rotted vegetables. When the lovely Buttercup is kidnapped and held prisoner by The Head, it is up to her friends—a teddy bear, a mechanical mouse and marionette puppet to cross the international boundary and attempt their daring rescue.
Metrics
| Opening Weekend: | $19,913 (30.7% of total gross) |
| Legs: | 3.26 (domestic box office/biggest weekend) |
| Domestic Share: | 100.0% (domestic box office/worldwide) |
| Theater counts: | 27 opening theaters/27 max. theaters, 2.2 weeks average run per theater |
| Infl. Adj. Dom. BO | $97,546 |
Movie Details
| Domestic Releases: | September 7th, 2012 (Limited) by Hannover House, released as Toys in the Attic |
| Video Release: | February 5th, 2013 by Hannover House Video, released as Toys in the Attic |
| MPA Rating: | PG for some mild peril and brief smoking. (Rating bulletin 2237 (Cert #47885), 8/22/2012) |
| Running Time: | 80 minutes |
| Film format: | 3-D |
| Plot point: | Kidnap, Political, Rescue |
| Social setting: | Cold War |
| Source: | Original Screenplay |
| Genre: | Adventure |
| Production Method: | Stop-Motion Animation |
| Creative Type: | Kids Fiction |
| Production/Financing Companies: | Bio Illusion, Czech Television, Universal Production Partners, Kratky Film, Continental Film, At Armz |
| Production Countries: | Czech Republic |
| Languages: | English |
Weekend Box Office Performance
| Date | Rank | Gross | % Change | Theaters | Per Theater | Total Gross | Week |
|---|---|---|---|---|---|---|---|
| Sep 7, 2012 | 63 | $19,913 | 27 | $738 | $19,913 | 1 | |
| Sep 14, 2012 | 70 | $11,615 | -42% | 14 | $830 | $38,033 | 2 |
| Sep 21, 2012 | 76 | $6,371 | -45% | 6 | $1,062 | $48,562 | 3 |
| Sep 28, 2012 | 74 | $7,870 | +24% | 6 | $1,312 | $59,777 | 4 |
| Oct 5, 2012 | 89 | $1,839 | -77% | 4 | $460 | $63,015 | 5 |
| Oct 12, 2012 | 91 | $823 | -55% | 2 | $412 | $64,918 | 6 |
Daily Box Office Performance
| Date | Rank | Gross | %YD | %LW | Theaters | Per Theater | Total Gross | Days |
|---|---|---|---|---|---|---|---|---|
| Sep 7, 2012 | - | $3,952 | 24 | $165 | $3,952 | 1 | ||
| Sep 8, 2012 | - | $6,658 | +68% | 26 | $256 | $10,610 | 2 | |
| Sep 9, 2012 | - | $9,303 | +40% | 27 | $345 | $19,913 | 3 | |
| Sep 10, 2012 | - | $1,648 | -82% | 25 | $66 | $21,561 | 4 | |
| Sep 11, 2012 | - | $1,915 | +16% | 25 | $77 | $23,476 | 5 | |
| Sep 12, 2012 | - | $1,550 | -19% | 25 | $62 | $25,026 | 6 | |
| Sep 13, 2012 | - | $1,392 | -10% | 25 | $56 | $26,418 | 7 | |
| Sep 14, 2012 | - | $5,820 | +318% | +47% | 14 | $416 | $32,238 | 8 |
| Sep 15, 2012 | - | $2,885 | -50% | -57% | 14 | $206 | $35,123 | 9 |
| Sep 16, 2012 | - | $2,910 | +1% | -69% | 14 | $208 | $38,033 | 10 |
| Sep 17, 2012 | - | $975 | -66% | -41% | 14 | $70 | $39,008 | 11 |
| Sep 18, 2012 | - | $1,020 | +5% | -47% | 14 | $73 | $40,028 | 12 |
| Sep 19, 2012 | - | $898 | -12% | -42% | 14 | $64 | $40,926 | 13 |
| Sep 20, 2012 | - | $1,265 | +41% | -9% | 14 | $90 | $42,191 | 14 |
| Sep 21, 2012 | - | $1,820 | +44% | -69% | 6 | $303 | $44,011 | 15 |
| Sep 22, 2012 | - | $2,505 | +38% | -13% | 6 | $418 | $46,516 | 16 |
| Sep 23, 2012 | - | $2,046 | -18% | -30% | 6 | $341 | $48,562 | 17 |
| Sep 24, 2012 | - | $725 | -65% | -26% | 6 | $121 | $49,287 | 18 |
| Sep 25, 2012 | - | $876 | +21% | -14% | 6 | $146 | $50,163 | 19 |
| Sep 26, 2012 | - | $830 | -5% | -8% | 6 | $138 | $50,993 | 20 |
| Sep 27, 2012 | - | $914 | +10% | -28% | 6 | $152 | $51,907 | 21 |
| Sep 28, 2012 | - | $1,790 | +96% | -2% | 6 | $298 | $53,697 | 22 |
| Sep 29, 2012 | - | $3,675 | +105% | +47% | 6 | $613 | $57,372 | 23 |
| Sep 30, 2012 | - | $2,405 | -35% | +18% | 6 | $401 | $59,777 | 24 |
| Oct 1, 2012 | - | $290 | -88% | -60% | 6 | $48 | $60,067 | 25 |
| Oct 2, 2012 | - | $314 | +8% | -64% | 6 | $52 | $60,381 | 26 |
| Oct 3, 2012 | - | $335 | +7% | -60% | 6 | $56 | $60,716 | 27 |
| Oct 4, 2012 | - | $460 | +37% | -50% | 6 | $77 | $61,176 | 28 |
| Oct 5, 2012 | - | $688 | +50% | -62% | 4 | $172 | $61,864 | 29 |
| Oct 6, 2012 | - | $642 | -7% | -83% | 4 | $161 | $62,506 | 30 |
| Oct 7, 2012 | - | $509 | -21% | -79% | 4 | $127 | $63,015 | 31 |
| Oct 8, 2012 | - | $216 | -58% | -26% | 4 | $54 | $63,231 | 32 |
| Oct 9, 2012 | - | $255 | +18% | -19% | 4 | $64 | $63,486 | 33 |
| Oct 10, 2012 | - | $311 | +22% | -7% | 4 | $78 | $63,797 | 34 |
| Oct 11, 2012 | - | $298 | -4% | -35% | 4 | $75 | $64,095 | 35 |
| Oct 12, 2012 | - | $252 | -15% | -63% | 2 | $126 | $64,347 | 36 |
| Oct 13, 2012 | - | $296 | +17% | -54% | 2 | $148 | $64,643 | 37 |
| Oct 14, 2012 | - | $275 | -7% | -46% | 2 | $138 | $64,918 | 38 |
Weekly Box Office Performance
| Date | Rank | Gross | % Change | Theaters | Per Theater | Total Gross | Week |
|---|---|---|---|---|---|---|---|
| Sep 7, 2012 | 65 | $26,418 | 25 | $1,057 | $26,418 | 1 | |
| Sep 14, 2012 | 69 | $15,773 | -40% | 14 | $1,127 | $42,191 | 2 |
| Sep 21, 2012 | 78 | $9,716 | -38% | 6 | $1,619 | $51,907 | 3 |
| Sep 28, 2012 | 81 | $9,269 | -5% | 6 | $1,545 | $61,176 | 4 |
| Oct 5, 2012 | 89 | $2,919 | -69% | 4 | $730 | $64,095 | 5 |
| Oct 12, 2012 | 99 | $823 | -72% | 2 | $412 | $64,918 | 6 |
Lead Ensemble Member
| Forest Whitaker | Teddy | |
| Joan Cusack | Madame Curie | |
| Cary Elwes | Sir Handsome | |
| Vivian Schilling | Buttercup | |
| Emily Hahn | Andrejka | |
| Douglas Urbanski | The Head | |
| Marcelo Tubert | Laurent | |
| Rico Simonini | Black Cat |
Production and Technical Credits
| Jiri Barta | Director | |
| Edger Dutka | Screenwriter | |
| Jiri Barta | Screenwriter | |
| Miroslav Smidmajer | Producer | |
| Jiri Holan | Executive Producer | |
| Magdalena Sedlakova | Co-Producer | |
| Vit Komrzy | Co-Producer | |
| Yvona Benyskova | Co-Producer | |
| Anton Drobny | Co-Producer | |
| Toskiharu Manabe | Co-Producer | |
| Ivan Vit | Cinematographer | |
| Lucie Haladova | Editor | |
| Michal Pavlicek | Composer |
Cast and crew with above-the-line roles are marked in bold. The line marks the division between above-the-line and below-the-line roles.
Full financial estimates for this film, including domestic and international box office, video sales, video rentals, TV and ancillary revenue are available through our research services. For more information, please contact us at research@the-numbers.com.