Neshoba: The Price of Freedom (2010)
| Theatrical Performance | ||
| Domestic Box Office | $19,245 | Details |
| OpusData ID: 139950100 More info... | ||
| Further financial details... | ||
Synopsis
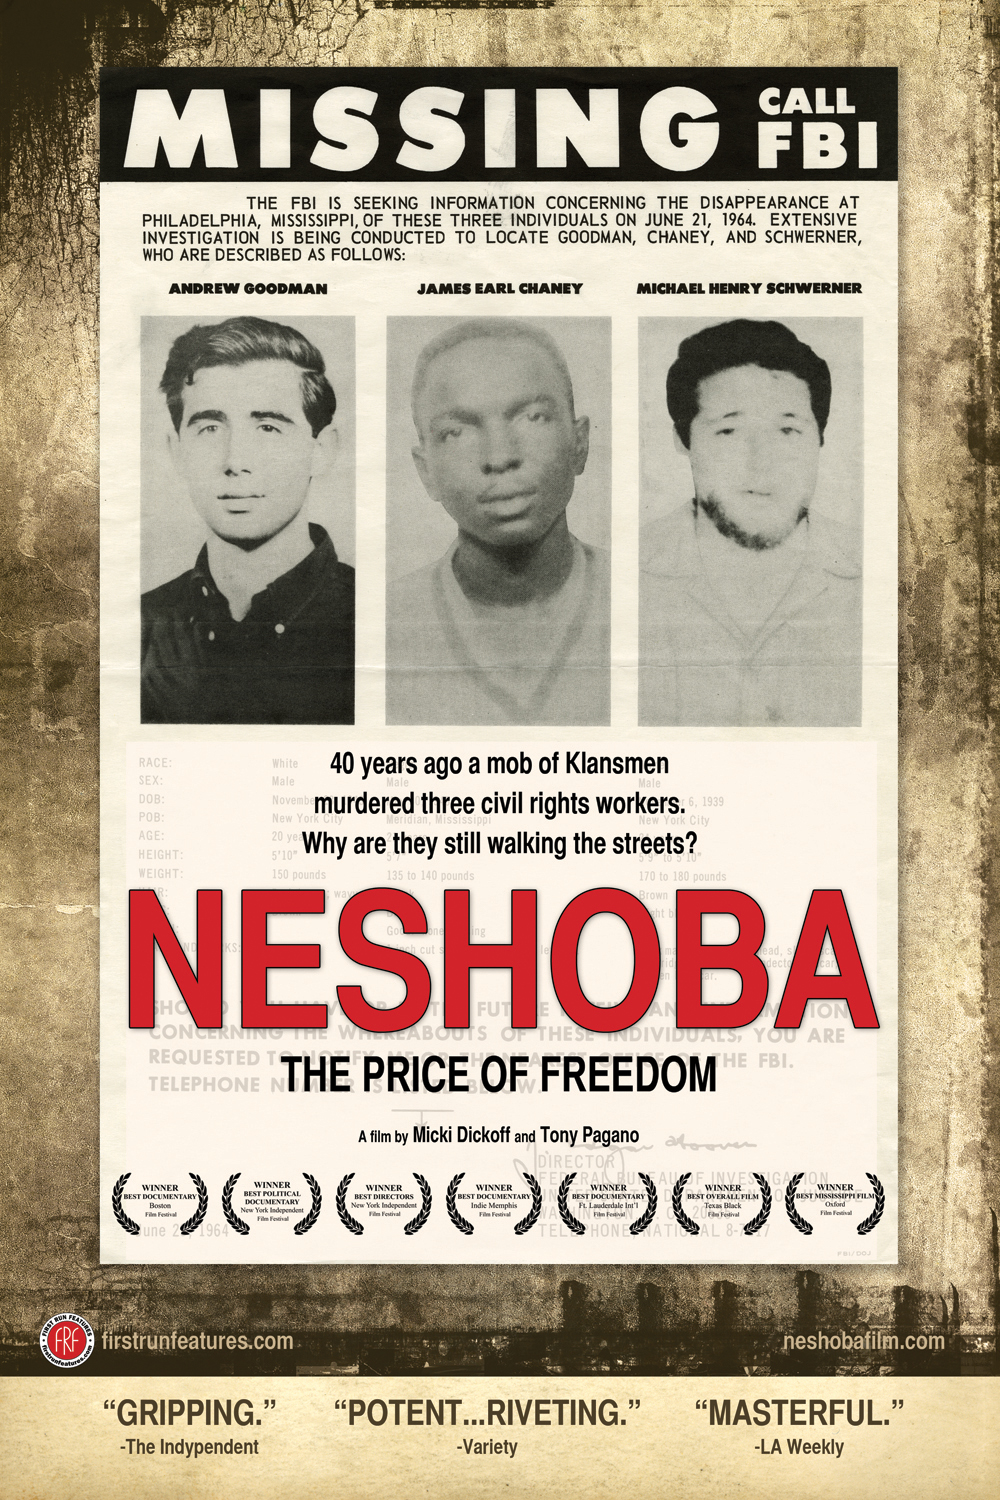
In 1964, a mob of Klansmen murdered three civil rights workers in the small Mississippi county of Neshoba (a crime that came to be known as the "Mississippi Burning" murders). These young men, two Jews from New York and an African-American from Mississippi, were in the Deep South helping register African-American voters during what became known as "Freedom Summer." Although the Klansmen bragged about what they did, no one was held accountable for murder until 2005, when the State indicted the mastermind of the killings, Edgar Ray Killen, an 80-year-old Baptist preacher and notorious racist.
Metrics
| Opening Weekend: | $4,645 (24.1% of total gross) |
| Legs: | 4.14 (domestic box office/biggest weekend) |
| Domestic Share: | 100.0% (domestic box office/worldwide) |
| Theater counts: | 1 opening theaters/2 max. theaters, 5.0 weeks average run per theater |
| Infl. Adj. Dom. BO | $29,170 |
Movie Details
| Domestic Releases: | August 13th, 2010 (Limited) by First Run Features |
| MPA Rating: | Not Rated |
| Running Time: | 90 minutes |
| Plot point: | Political |
| Subgenre: | Courtroom / Legal Drama |
| Source: | Based on Real Life Events |
| Genre: | Documentary |
| Production Method: | Live Action |
| Creative Type: | Factual |
| Production/Financing Companies: | Pro Bono, Pagano |
| Production Countries: | United States |
| Languages: | English |
Weekend Box Office Performance
| Date | Rank | Gross | % Change | Theaters | Per Theater | Total Gross | Week |
|---|---|---|---|---|---|---|---|
| Aug 13, 2010 | 78 | $4,645 | 1 | $4,645 | $4,645 | 1 | |
| Aug 20, 2010 | 82 | $2,616 | -44% | 2 | $1,308 | $9,838 | 2 |
| Sep 10, 2010 | 101 | $3,334 | 1 | $3,334 | $15,844 | 5 | |
| Sep 17, 2010 | 126 | $847 | -75% | 2 | $424 | $17,429 | 6 |
| Sep 24, 2010 | 130 | $347 | -59% | 1 | $347 | $18,184 | 7 |
| Oct 1, 2010 | 123 | $536 | +54% | 1 | $536 | $18,727 | 8 |
| Oct 8, 2010 | 132 | $227 | -58% | 1 | $227 | $18,954 | 9 |
| Oct 15, 2010 | 133 | $265 | +17% | 1 | $265 | $19,219 | 10 |
Weekly Box Office Performance
| Date | Rank | Gross | % Change | Theaters | Per Theater | Total Gross | Week |
|---|---|---|---|---|---|---|---|
| Aug 13, 2010 | 87 | $4,645 | 1 | $4,645 | $7,222 | 1 | |
| Aug 20, 2010 | 84 | $3,168 | -32% | 2 | $1,584 | $12,422 | 2 |
| Sep 3, 2010 | 118 | $88 | 1 | $88 | $12,510 | 4 | |
| Sep 10, 2010 | 103 | $4,072 | +4,527% | 1 | $4,072 | $16,582 | 5 |
| Sep 17, 2010 | 126 | $1,255 | -69% | 2 | $628 | $17,837 | 6 |
| Sep 24, 2010 | 132 | $347 | -72% | 1 | $347 | $18,191 | 7 |
| Oct 1, 2010 | 129 | $536 | +54% | 1 | $536 | $18,727 | 8 |
| Oct 8, 2010 | 134 | $227 | -58% | 1 | $227 | $18,954 | 9 |
| Oct 15, 2010 | 140 | $291 | +28% | 1 | $291 | $19,245 | 10 |
Full financial estimates for this film, including domestic and international box office, video sales, video rentals, TV and ancillary revenue are available through our research services. For more information, please contact us at research@the-numbers.com.
Synopsis
In 1964, a mob of Klansmen murdered three civil rights workers in the small Mississippi county of Neshoba (a crime that came to be known as the "Mississippi Burning" murders). These young men, two Jews from New York and an African-American from Mississippi, were in the Deep South helping register African-American voters during what became known as "Freedom Summer." Although the Klansmen bragged about what they did, no one was held accountable for murder until 2005, when the State indicted the mastermind of the killings, Edgar Ray Killen, an 80-year-old Baptist preacher and notorious racist.
Metrics
| Opening Weekend: | $4,645 (24.1% of total gross) |
| Legs: | 4.14 (domestic box office/biggest weekend) |
| Domestic Share: | 100.0% (domestic box office/worldwide) |
| Theater counts: | 1 opening theaters/2 max. theaters, 5.0 weeks average run per theater |
| Infl. Adj. Dom. BO | $29,170 |
Movie Details
| Domestic Releases: | August 13th, 2010 (Limited) by First Run Features |
| MPA Rating: | Not Rated |
| Running Time: | 90 minutes |
| Plot point: | Political |
| Subgenre: | Courtroom / Legal Drama |
| Source: | Based on Real Life Events |
| Genre: | Documentary |
| Production Method: | Live Action |
| Creative Type: | Factual |
| Production/Financing Companies: | Pro Bono, Pagano |
| Production Countries: | United States |
| Languages: | English |
Weekend Box Office Performance
| Date | Rank | Gross | % Change | Theaters | Per Theater | Total Gross | Week |
|---|---|---|---|---|---|---|---|
| Aug 13, 2010 | 78 | $4,645 | 1 | $4,645 | $4,645 | 1 | |
| Aug 20, 2010 | 82 | $2,616 | -44% | 2 | $1,308 | $9,838 | 2 |
| Sep 10, 2010 | 101 | $3,334 | 1 | $3,334 | $15,844 | 5 | |
| Sep 17, 2010 | 126 | $847 | -75% | 2 | $424 | $17,429 | 6 |
| Sep 24, 2010 | 130 | $347 | -59% | 1 | $347 | $18,184 | 7 |
| Oct 1, 2010 | 123 | $536 | +54% | 1 | $536 | $18,727 | 8 |
| Oct 8, 2010 | 132 | $227 | -58% | 1 | $227 | $18,954 | 9 |
| Oct 15, 2010 | 133 | $265 | +17% | 1 | $265 | $19,219 | 10 |
Weekly Box Office Performance
| Date | Rank | Gross | % Change | Theaters | Per Theater | Total Gross | Week |
|---|---|---|---|---|---|---|---|
| Aug 13, 2010 | 87 | $4,645 | 1 | $4,645 | $7,222 | 1 | |
| Aug 20, 2010 | 84 | $3,168 | -32% | 2 | $1,584 | $12,422 | 2 |
| Sep 3, 2010 | 118 | $88 | 1 | $88 | $12,510 | 4 | |
| Sep 10, 2010 | 103 | $4,072 | +4,527% | 1 | $4,072 | $16,582 | 5 |
| Sep 17, 2010 | 126 | $1,255 | -69% | 2 | $628 | $17,837 | 6 |
| Sep 24, 2010 | 132 | $347 | -72% | 1 | $347 | $18,191 | 7 |
| Oct 1, 2010 | 129 | $536 | +54% | 1 | $536 | $18,727 | 8 |
| Oct 8, 2010 | 134 | $227 | -58% | 1 | $227 | $18,954 | 9 |
| Oct 15, 2010 | 140 | $291 | +28% | 1 | $291 | $19,245 | 10 |
Full financial estimates for this film, including domestic and international box office, video sales, video rentals, TV and ancillary revenue are available through our research services. For more information, please contact us at research@the-numbers.com.