The Olivia Experiment (2014)
| Theatrical Performance | ||
| Domestic Box Office | $15,122 | Details |
| OpusData ID: 213890100 More info... | ||
| Further financial details... | ||
Synopsis
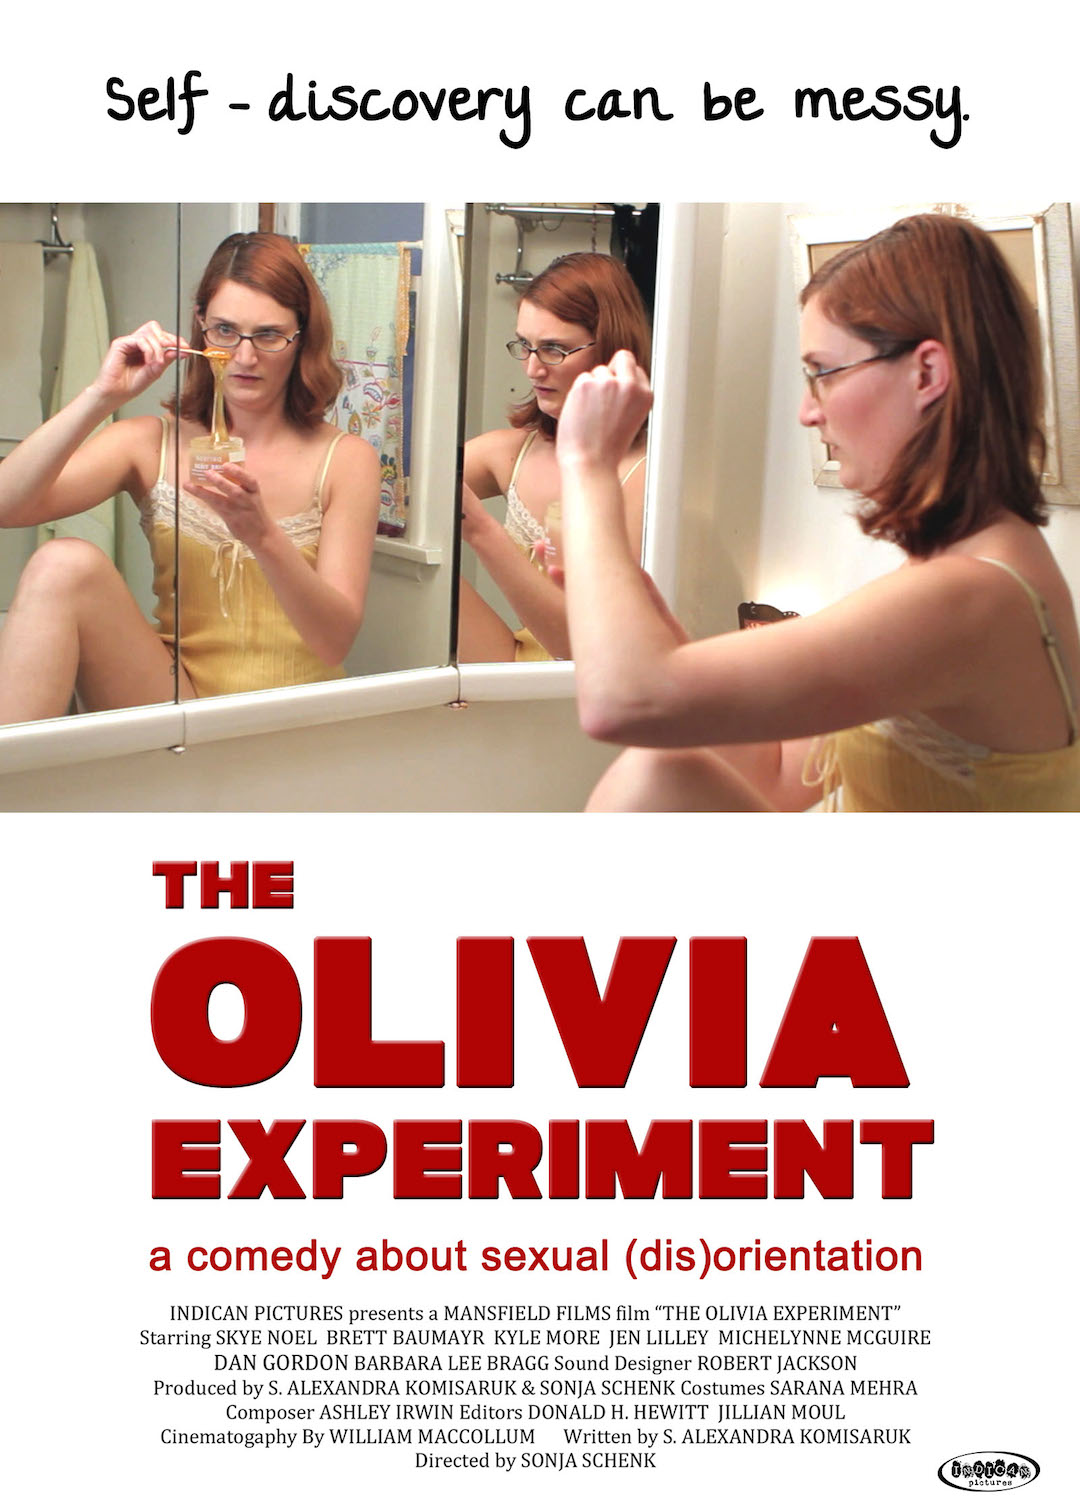
Olivia is a frustrated 27-year-old Gender Studies graduate student, angry at the porn-centric culture, who believes she’s an asexual. While dating and courtship rituals fascinate her in her studies, in real life she has yet to experience sex, let alone mutual attraction. Spurred by her academic advisor’s suggestion she “live a little”, Olivia accepts her friend Felisha’s offer to try sex with her own boyfriend, Julian. And, with the help of a lesbian camerawoman and an encouraging roommate, Olivia sets out to film her first sexual encounter. But in this comedy of sexual disorientation, the results of “The Olivia Experiment” are completely unexpected.
Metrics
| Opening Weekend: | $2,754 (18.2% of total gross) |
| Legs: | 5.49 (domestic box office/biggest weekend) |
| Domestic Share: | 100.0% (domestic box office/worldwide) |
| Theater counts: | 1 opening theaters/6 max. theaters, 3.7 weeks average run per theater |
| Infl. Adj. Dom. BO | $24,109 |
Movie Details
| Domestic Releases: | August 22nd, 2014 (Limited) by Indican Pictures |
| Video Release: | September 23rd, 2014 by Indican Home |
| MPA Rating: | Not Rated |
| Running Time: | 90 minutes |
| Plot point: | Asexual, LGBTQ+, Loss Of Virginity, Relationships Gone Wrong |
| Source: | Original Screenplay |
| Genre: | Comedy |
| Production Method: | Live Action |
| Creative Type: | Contemporary Fiction |
| Production/Financing Companies: | Mansfield Films |
| Production Countries: | United States |
| Languages: | English |
Weekend Box Office Performance
| Date | Rank | Gross | % Change | Theaters | Per Theater | Total Gross | Week |
|---|---|---|---|---|---|---|---|
| Aug 22, 2014 | 76 | $2,754 | 1 | $2,754 | $2,754 | 1 | |
| Aug 29, 2014 | 91 | $557 | -80% | 1 | $557 | $3,381 | 2 |
| Oct 24, 2014 | 96 | $1,962 | 1 | $1,962 | $3,381 | 10 | |
| Feb 27, 2015 | 93 | $500 | 1 | $500 | $4,904 | 28 | |
| Nov 4, 2016 | 84 | $1,500 | 6 | $250 | $6,404 | 116 | |
| Nov 11, 2016 | 86 | $1,250 | -17% | 6 | $208 | $8,776 | 117 |
| Nov 18, 2016 | 86 | $1,204 | -4% | 4 | $301 | $10,584 | 118 |
| Nov 25, 2016 | 92 | $750 | -38% | 2 | $375 | $12,526 | 119 |
Weekly Box Office Performance
| Date | Rank | Gross | % Change | Theaters | Per Theater | Total Gross | Week |
|---|---|---|---|---|---|---|---|
| Aug 22, 2014 | 75 | $4,716 | 1 | $4,716 | $4,716 | 1 | |
| Oct 31, 2014 | 98 | $1,023 | 1 | $1,023 | $6,366 | 11 | |
| Nov 4, 2016 | 98 | $1,122 | 6 | $187 | $9,488 | 116 | |
| Nov 11, 2016 | 101 | $1,854 | +65% | 5 | $371 | $11,342 | 117 |
| Nov 18, 2016 | 91 | $2,396 | +29% | 4 | $599 | $13,738 | 118 |
| Nov 25, 2016 | 101 | $1,384 | -42% | 2 | $692 | $15,122 | 119 |
Full financial estimates for this film, including domestic and international box office, video sales, video rentals, TV and ancillary revenue are available through our research services. For more information, please contact us at research@the-numbers.com.
Synopsis
Olivia is a frustrated 27-year-old Gender Studies graduate student, angry at the porn-centric culture, who believes she’s an asexual. While dating and courtship rituals fascinate her in her studies, in real life she has yet to experience sex, let alone mutual attraction. Spurred by her academic advisor’s suggestion she “live a little”, Olivia accepts her friend Felisha’s offer to try sex with her own boyfriend, Julian. And, with the help of a lesbian camerawoman and an encouraging roommate, Olivia sets out to film her first sexual encounter. But in this comedy of sexual disorientation, the results of “The Olivia Experiment” are completely unexpected.
Metrics
| Opening Weekend: | $2,754 (18.2% of total gross) |
| Legs: | 5.49 (domestic box office/biggest weekend) |
| Domestic Share: | 100.0% (domestic box office/worldwide) |
| Theater counts: | 1 opening theaters/6 max. theaters, 3.7 weeks average run per theater |
| Infl. Adj. Dom. BO | $24,109 |
Movie Details
| Domestic Releases: | August 22nd, 2014 (Limited) by Indican Pictures |
| Video Release: | September 23rd, 2014 by Indican Home |
| MPA Rating: | Not Rated |
| Running Time: | 90 minutes |
| Plot point: | Asexual, LGBTQ+, Loss Of Virginity, Relationships Gone Wrong |
| Source: | Original Screenplay |
| Genre: | Comedy |
| Production Method: | Live Action |
| Creative Type: | Contemporary Fiction |
| Production/Financing Companies: | Mansfield Films |
| Production Countries: | United States |
| Languages: | English |
Weekend Box Office Performance
| Date | Rank | Gross | % Change | Theaters | Per Theater | Total Gross | Week |
|---|---|---|---|---|---|---|---|
| Aug 22, 2014 | 76 | $2,754 | 1 | $2,754 | $2,754 | 1 | |
| Aug 29, 2014 | 91 | $557 | -80% | 1 | $557 | $3,381 | 2 |
| Oct 24, 2014 | 96 | $1,962 | 1 | $1,962 | $3,381 | 10 | |
| Feb 27, 2015 | 93 | $500 | 1 | $500 | $4,904 | 28 | |
| Nov 4, 2016 | 84 | $1,500 | 6 | $250 | $6,404 | 116 | |
| Nov 11, 2016 | 86 | $1,250 | -17% | 6 | $208 | $8,776 | 117 |
| Nov 18, 2016 | 86 | $1,204 | -4% | 4 | $301 | $10,584 | 118 |
| Nov 25, 2016 | 92 | $750 | -38% | 2 | $375 | $12,526 | 119 |
Weekly Box Office Performance
| Date | Rank | Gross | % Change | Theaters | Per Theater | Total Gross | Week |
|---|---|---|---|---|---|---|---|
| Aug 22, 2014 | 75 | $4,716 | 1 | $4,716 | $4,716 | 1 | |
| Oct 31, 2014 | 98 | $1,023 | 1 | $1,023 | $6,366 | 11 | |
| Nov 4, 2016 | 98 | $1,122 | 6 | $187 | $9,488 | 116 | |
| Nov 11, 2016 | 101 | $1,854 | +65% | 5 | $371 | $11,342 | 117 |
| Nov 18, 2016 | 91 | $2,396 | +29% | 4 | $599 | $13,738 | 118 |
| Nov 25, 2016 | 101 | $1,384 | -42% | 2 | $692 | $15,122 | 119 |
Full financial estimates for this film, including domestic and international box office, video sales, video rentals, TV and ancillary revenue are available through our research services. For more information, please contact us at research@the-numbers.com.