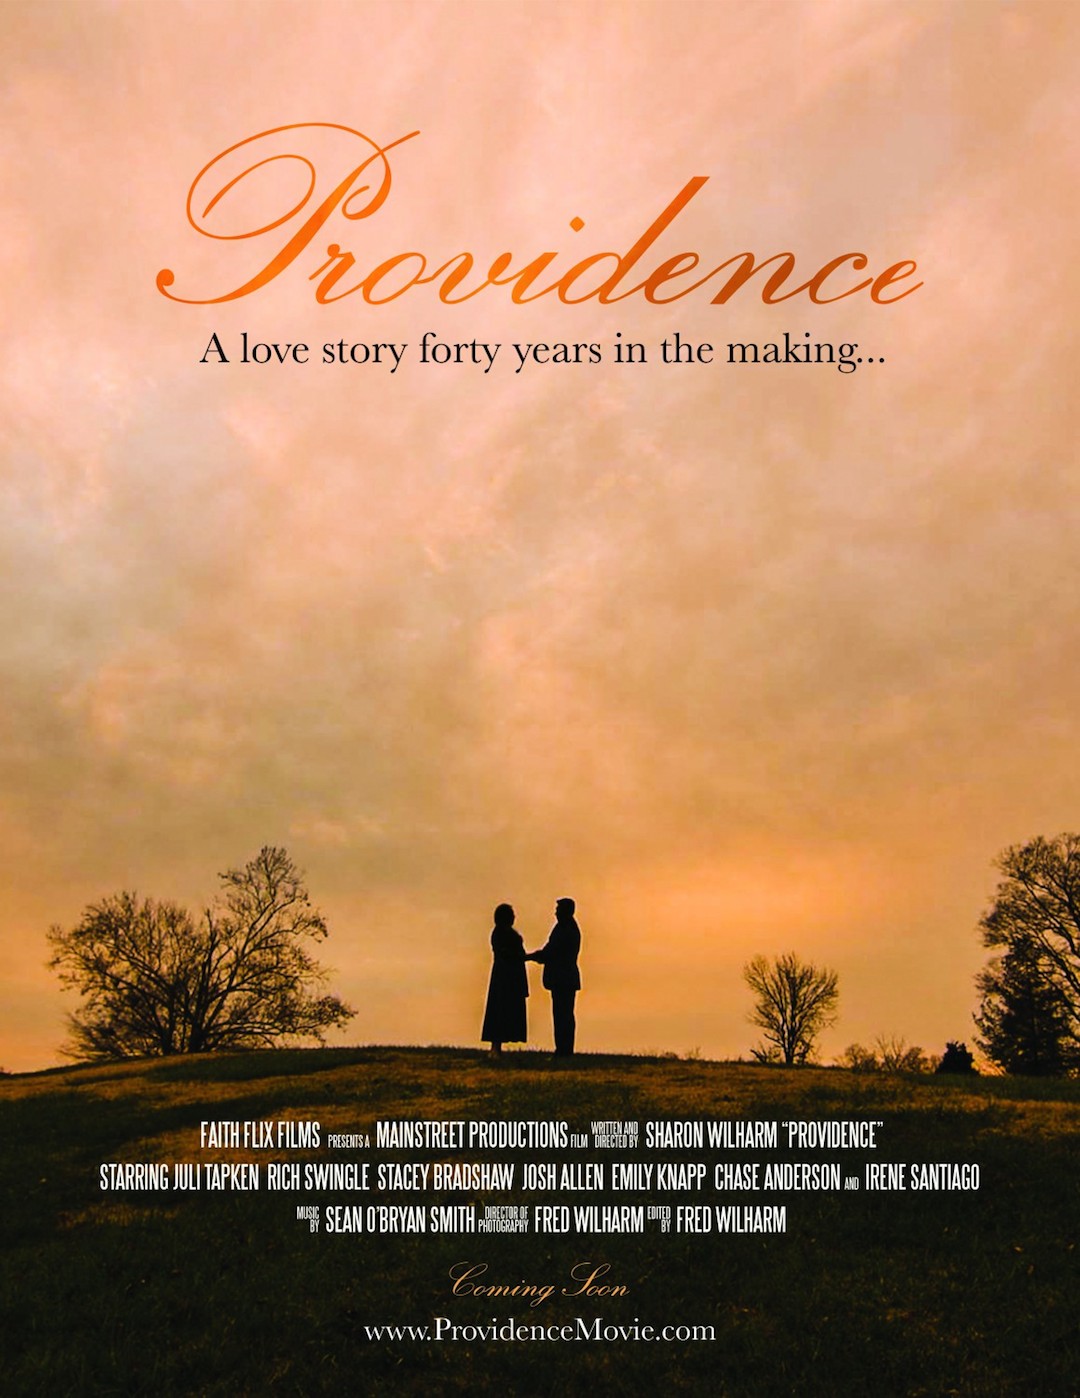
Providence (2016)
| Theatrical Performance | ||
| Domestic Box Office | $8,556 | Details |
| OpusData ID: 248670100 More info... | ||
| Further financial details... | ||
Synopsis
Rachel Cartwright and Mitchell Little both grow up in the small town of Providence, Tennessee. Their paths keep intersecting and at one point it looks like they’ll finally get together. But the opportunity slips away and they go their separate ways. It takes a tragedy many years later before they’re reunited. Their romance is told silent cinema style, using only dramatic action and a soundtrack of eclectic indie music to portray this emotional journey of love.
Metrics
| Opening Weekend: | $6,193 (72.4% of total gross) |
| Legs: | 1.38 (domestic box office/biggest weekend) |
| Domestic Share: | 100.0% (domestic box office/worldwide) |
| Theater counts: | 7 opening theaters/7 max. theaters, 1.1 weeks average run per theater |
| Infl. Adj. Dom. BO | $11,828 |
Movie Details
| Domestic Releases: | February 12th, 2016 (Limited) by Main Street |
| MPA Rating: | Not Rated |
| Running Time: | 79 minutes |
| Cast, crew, or production detail: | Silent Film |
| Plot point: | Romance |
| Social setting: | Life in a Small Town |
| Source: | Original Screenplay |
| Genre: | Drama |
| Production Method: | Live Action |
| Creative Type: | Contemporary Fiction |
| Production/Financing Companies: | Mainstreet Productions, Faith Flix Films |
| Production Countries: | United States |
| Languages: | Silent |
Weekend Box Office Performance
| Date | Rank | Gross | % Change | Theaters | Per Theater | Total Gross | Week |
|---|---|---|---|---|---|---|---|
| Feb 12, 2016 | 67 | $6,193 | 7 | $885 | $6,193 | 1 | |
| Apr 1, 2016 | 105 | $198 | 1 | $198 | $8,556 | 8 |
Daily Box Office Performance
| Date | Rank | Gross | % Change | Theaters | Per Theater | Total Gross | Days |
|---|---|---|---|---|---|---|---|
| Feb 12, 2016 | - | $2,199 | 7 | $314 | $2,199 | 1 | |
| Feb 13, 2016 | - | $2,251 | +2% | 7 | $322 | $4,450 | 2 |
| Feb 14, 2016 | - | $1,743 | -23% | 7 | $249 | $6,193 | 3 |
| Feb 15, 2016 | - | $806 | -54% | 7 | $115 | $6,999 | 4 |
| Feb 16, 2016 | - | $432 | -46% | 7 | $62 | $7,431 | 5 |
| Feb 17, 2016 | - | $393 | -9% | 7 | $56 | $7,824 | 6 |
| Feb 18, 2016 | - | $358 | -9% | 7 | $51 | $8,182 | 7 |
Weekly Box Office Performance
| Date | Rank | Gross | % Change | Theaters | Per Theater | Total Gross | Week |
|---|---|---|---|---|---|---|---|
| Feb 12, 2016 | 71 | $8,182 | 7 | $1,169 | $8,182 | 1 | |
| Feb 19, 2016 | 105 | $176 | -98% | 1 | $176 | $8,358 | 2 |
Full financial estimates for this film, including domestic and international box office, video sales, video rentals, TV and ancillary revenue are available through our research services. For more information, please contact us at research@the-numbers.com.