The Road to Wellville (1994)
| Theatrical Performance | ||
| Domestic Box Office | $6,487,257 | Details |
| OpusData ID: 43380100 More info... | ||
| Further financial details... | ||
Synopsis
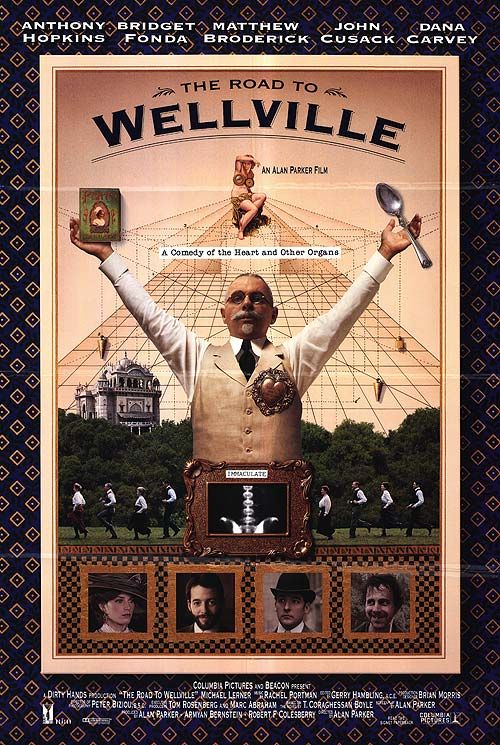
Set in 1907, Dr. John Harvey Kellogg runs the Battle Creek Sanitarium based on his bizarre beliefs about health. Much of the story focuses on Will and Eleanor Lightbody, a young couple who came to heal and sort out their difficulties.
Metrics
| Opening Weekend: | $2,580,108 (39.8% of total gross) |
| Legs: | 2.51 (domestic box office/biggest weekend) |
| Domestic Share: | 100.0% (domestic box office/worldwide) |
| Theater counts: | 806 opening theaters/806 max. theaters, 3.4 weeks average run per theater |
| Infl. Adj. Dom. BO | $17,983,047 |
Movie Details
| Domestic Releases: | October 28th, 1994 (Wide) by Sony Pictures |
| Video Release: | January 1st, 2002 by Sony Pictures Home Entertainment |
| MPA Rating: | R for sex-related humor |
| Running Time: | 120 minutes |
| Cast, crew, or production detail: | Epilogue, Non-Drama Biographies |
| Plot point: | Biography, Doctors, Satire |
| Social setting: | Health & Fitness |
| Subgenre: | Satirical Comedy |
| Time period setting: | 1900s |
| Source: | Based on Fiction Book/Short Story |
| Genre: | Comedy |
| Production Method: | Live Action |
| Creative Type: | Historical Fiction |
| Production/Financing Companies: | Columbia Pictures, Beacon Pictures, Dirty Hands |
| Production Countries: | United States |
| Languages: | English |
Weekend Box Office Performance
| Date | Rank | Gross | % Change | Theaters | Per Theater | Total Gross | Week |
|---|---|---|---|---|---|---|---|
| Oct 28, 1994 | 5 | $2,580,108 | 806 | $3,201 | $2,580,108 | 1 | |
| Nov 4, 1994 | 10 | $1,510,911 | -41% | 806 | $1,875 | $4,867,428 | 2 |
| Nov 11, 1994 | 15 | $725,993 | -52% | 770 | $943 | $6,036,125 | 3 |
| Dec 9, 1994 | 39 | $50,153 | 235 | $213 | $6,430,387 | 7 | |
| Dec 16, 1994 | 43 | $39,826 | -21% | 93 | $428 | $6,487,257 | 8 |
Weekly Box Office Performance
| Date | Rank | Gross | % Change | Theaters | Per Theater | Total Gross | Week |
|---|---|---|---|---|---|---|---|
| Oct 28, 1994 | 5 | $3,356,517 | 806 | $4,164 | $3,356,517 | 1 | |
| Nov 4, 1994 | 10 | $1,953,615 | -42% | 806 | $2,424 | $5,310,132 | 2 |
| Dec 9, 1994 | 39 | $67,197 | 235 | $286 | $6,447,431 | 7 |
Synopsis
Set in 1907, Dr. John Harvey Kellogg runs the Battle Creek Sanitarium based on his bizarre beliefs about health. Much of the story focuses on Will and Eleanor Lightbody, a young couple who came to heal and sort out their difficulties.
Metrics
| Opening Weekend: | $2,580,108 (39.8% of total gross) |
| Legs: | 2.51 (domestic box office/biggest weekend) |
| Domestic Share: | 100.0% (domestic box office/worldwide) |
| Theater counts: | 806 opening theaters/806 max. theaters, 3.4 weeks average run per theater |
| Infl. Adj. Dom. BO | $17,983,047 |
Movie Details
| Domestic Releases: | October 28th, 1994 (Wide) by Sony Pictures |
| Video Release: | January 1st, 2002 by Sony Pictures Home Entertainment |
| MPA Rating: | R for sex-related humor |
| Running Time: | 120 minutes |
| Cast, crew, or production detail: | Epilogue, Non-Drama Biographies |
| Plot point: | Biography, Doctors, Satire |
| Social setting: | Health & Fitness |
| Subgenre: | Satirical Comedy |
| Time period setting: | 1900s |
| Source: | Based on Fiction Book/Short Story |
| Genre: | Comedy |
| Production Method: | Live Action |
| Creative Type: | Historical Fiction |
| Production/Financing Companies: | Columbia Pictures, Beacon Pictures, Dirty Hands |
| Production Countries: | United States |
| Languages: | English |
Weekend Box Office Performance
| Date | Rank | Gross | % Change | Theaters | Per Theater | Total Gross | Week |
|---|---|---|---|---|---|---|---|
| Oct 28, 1994 | 5 | $2,580,108 | 806 | $3,201 | $2,580,108 | 1 | |
| Nov 4, 1994 | 10 | $1,510,911 | -41% | 806 | $1,875 | $4,867,428 | 2 |
| Nov 11, 1994 | 15 | $725,993 | -52% | 770 | $943 | $6,036,125 | 3 |
| Dec 9, 1994 | 39 | $50,153 | 235 | $213 | $6,430,387 | 7 | |
| Dec 16, 1994 | 43 | $39,826 | -21% | 93 | $428 | $6,487,257 | 8 |
Weekly Box Office Performance
| Date | Rank | Gross | % Change | Theaters | Per Theater | Total Gross | Week |
|---|---|---|---|---|---|---|---|
| Oct 28, 1994 | 5 | $3,356,517 | 806 | $4,164 | $3,356,517 | 1 | |
| Nov 4, 1994 | 10 | $1,953,615 | -42% | 806 | $2,424 | $5,310,132 | 2 |
| Dec 9, 1994 | 39 | $67,197 | 235 | $286 | $6,447,431 | 7 |