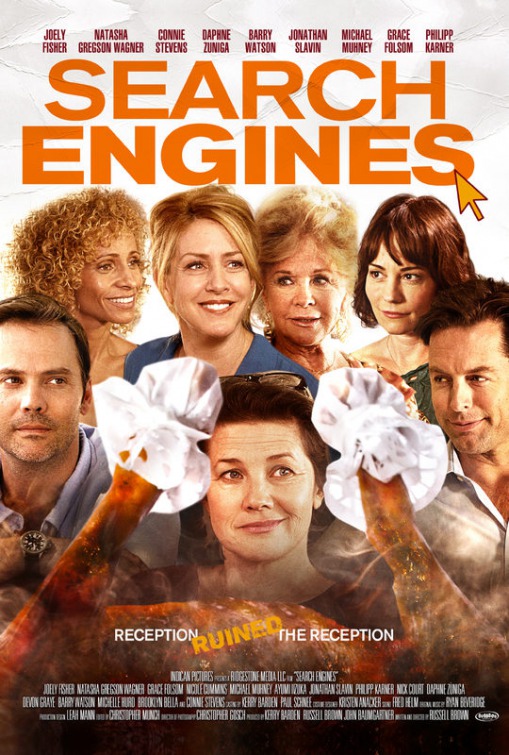
Search Engines (2016)
| Theatrical Performance | ||
| Domestic Box Office | $18,851 | Details |
| OpusData ID: 267140100 More info... | ||
| Further financial details... | ||
Synopsis
It’s Thanksgiving, and family and friends have gathered for the annual American celebration of togetherness and gratitude. When reception mysteriously goes dead throughout the house, each character must deal with his own crisis: marriages are tested, values questioned and everyone’s future is thrown into the balance. If the human experience is one of search — for meaning, purpose and’ love — this is a story of how technology is leading us further astray’
Metrics
| Opening Weekend: | $3,044 (16.1% of total gross) |
| Legs: | 6.19 (domestic box office/biggest weekend) |
| Domestic Share: | 100.0% (domestic box office/worldwide) |
| Theater counts: | 2 opening theaters/6 max. theaters, 3.5 weeks average run per theater |
| Infl. Adj. Dom. BO | $26,061 |
Movie Details
| Domestic Releases: | October 14th, 2016 (Limited) by Indican Pictures |
| MPA Rating: | Not Rated |
| Running Time: | 95 minutes |
| Plot point: | Dysfunctional Family, Internet, Off the Grid |
| Social setting: | Thanksgiving |
| Source: | Original Screenplay |
| Genre: | Comedy |
| Production Method: | Live Action |
| Creative Type: | Contemporary Fiction |
| Production/Financing Companies: | Indican Pictures, Ridgestone Media LLC |
| Production Countries: | United States |
| Languages: | English |
Weekend Box Office Performance
| Date | Rank | Gross | % Change | Theaters | Per Theater | Total Gross | Week |
|---|---|---|---|---|---|---|---|
| Oct 14, 2016 | 85 | $3,044 | 2 | $1,522 | $3,044 | 1 | |
| Oct 28, 2016 | 100 | $971 | 1 | $971 | $5,913 | 3 | |
| Nov 4, 2016 | 108 | $600 | -38% | 2 | $300 | $7,117 | 4 |
| Nov 11, 2016 | 101 | $706 | +18% | 2 | $353 | $8,675 | 5 |
| Nov 18, 2016 | 81 | $1,504 | +113% | 2 | $752 | $10,683 | 6 |
| Nov 25, 2016 | 74 | $1,800 | +20% | 6 | $300 | $14,487 | 7 |
| Dec 2, 2016 | 83 | $1,588 | -12% | 3 | $529 | $16,789 | 8 |
| Dec 9, 2016 | 98 | $275 | -83% | 1 | $275 | $17,065 | 9 |
| Dec 16, 2016 | 86 | $500 | +82% | 2 | $250 | $17,909 | 10 |
Weekly Box Office Performance
| Date | Rank | Gross | % Change | Theaters | Per Theater | Total Gross | Week |
|---|---|---|---|---|---|---|---|
| Oct 14, 2016 | 98 | $3,044 | 2 | $1,522 | $3,044 | 1 | |
| Oct 21, 2016 | 108 | $1,898 | -38% | 2 | $949 | $4,942 | 2 |
| Oct 28, 2016 | 113 | $604 | -68% | 1 | $604 | $6,517 | 3 |
| Nov 4, 2016 | 104 | $852 | +41% | 2 | $426 | $7,969 | 4 |
| Nov 11, 2016 | 112 | $1,210 | +42% | 1 | $1,210 | $9,179 | 5 |
| Nov 18, 2016 | 81 | $3,508 | +190% | 2 | $1,754 | $12,687 | 6 |
| Nov 25, 2016 | 82 | $2,514 | -28% | 6 | $419 | $15,201 | 7 |
| Dec 2, 2016 | 104 | $1,589 | -37% | 1 | $1,589 | $16,790 | 8 |
| Dec 9, 2016 | 105 | $619 | -61% | 1 | $619 | $17,409 | 9 |
| Dec 16, 2016 | 86 | $1,067 | +72% | 2 | $534 | $18,476 | 10 |
| Dec 23, 2016 | 90 | $375 | -65% | 1 | $375 | $18,851 | 11 |
Full financial estimates for this film, including domestic and international box office, video sales, video rentals, TV and ancillary revenue are available through our research services. For more information, please contact us at research@the-numbers.com.