Somebody Up There Likes Me (2013)
| Theatrical Performance | ||
| Domestic Box Office | $89,435 | Details |
| OpusData ID: 187740100 More info... | ||
| Further financial details... | ||
Synopsis
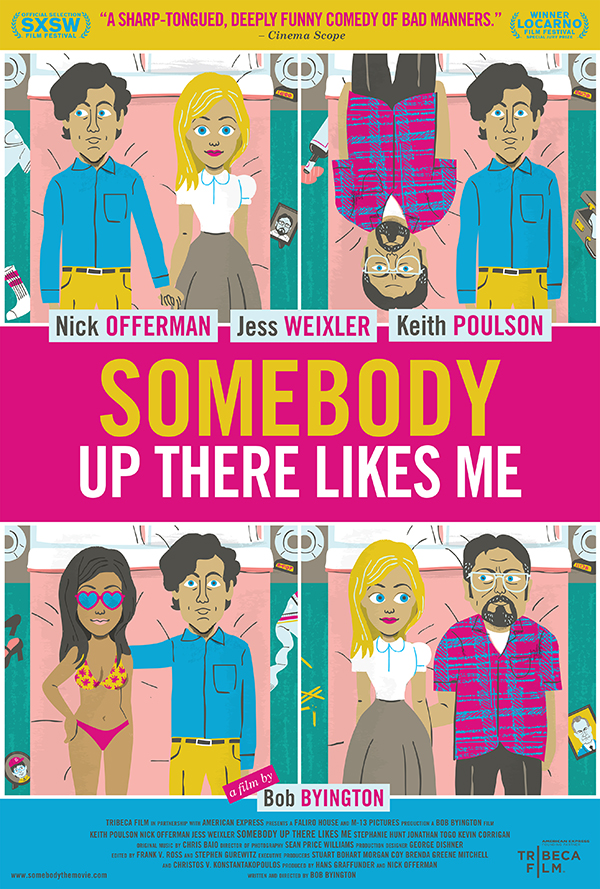
SOMEBODY UP THERE LIKES ME skips through 35 years in the life of Max Youngman, his best (and only) friend Sal, and the woman they both adore. As they stumble in and out of hilariously misguided relationships - strung together with animated vignettes. Max never ages, holding on to a mysterious briefcase that may or may not contain the secret to life.
Metrics
| Opening Weekend: | $34,362 (38.4% of total gross) |
| Legs: | 2.60 (domestic box office/biggest weekend) |
| Domestic Share: | 100.0% (domestic box office/worldwide) |
| Theater counts: | 1 opening theaters/3 max. theaters, 2.7 weeks average run per theater |
| Infl. Adj. Dom. BO | $131,572 |
Movie Details
| Domestic Releases: | March 8th, 2013 (Limited) by TriBeca Films |
| MPA Rating: | Not Rated |
| Running Time: | 76 minutes |
| Cast, crew, or production detail: | Animated Sequences |
| Plot point: | Love Triangle, Romance |
| Source: | Original Screenplay |
| Genre: | Comedy |
| Production Method: | Animation/Live Action |
| Creative Type: | Contemporary Fiction |
| Production/Financing Companies: | Faliro House Productions, M-13 Pictures |
| Production Countries: | United States |
| Languages: | English |
Weekend Box Office Performance
| Date | Rank | Gross | % Change | Theaters | Per Theater | Total Gross | Week |
|---|---|---|---|---|---|---|---|
| Mar 8, 2013 | 50 | $34,362 | 1 | $34,362 | $34,362 | 1 | |
| Mar 15, 2013 | 66 | $12,310 | -64% | 1 | $12,310 | $47,487 | 2 |
| Mar 22, 2013 | 82 | $6,424 | -48% | 2 | $3,212 | $57,726 | 3 |
| Mar 29, 2013 | 66 | $17,565 | +173% | 3 | $5,855 | $77,095 | 4 |
| Apr 5, 2013 | 81 | $5,498 | -69% | 1 | $5,498 | $83,796 | 5 |
Weekly Box Office Performance
| Date | Rank | Gross | % Change | Theaters | Per Theater | Total Gross | Week |
|---|---|---|---|---|---|---|---|
| Mar 8, 2013 | 59 | $35,177 | 1 | $35,177 | $35,177 | 1 | |
| Mar 15, 2013 | 69 | $16,125 | -54% | 1 | $16,125 | $51,302 | 2 |
| Mar 22, 2013 | 86 | $8,228 | -49% | 2 | $4,114 | $59,530 | 3 |
| Mar 29, 2013 | 72 | $18,768 | +128% | 3 | $6,256 | $78,298 | 4 |
| Apr 5, 2013 | 89 | $6,700 | -64% | 1 | $6,700 | $84,998 | 5 |
| Apr 12, 2013 | 96 | $2,090 | -69% | 2 | $1,045 | $86,043 | 6 |
| May 10, 2013 | 109 | $1,540 | 1 | $1,540 | $87,583 | 10 | |
| May 31, 2013 | 84 | $1,049 | 2 | $525 | $88,632 | 13 | |
| Oct 11, 2013 | 108 | $803 | 1 | $803 | $89,435 | 32 |
Full financial estimates for this film, including domestic and international box office, video sales, video rentals, TV and ancillary revenue are available through our research services. For more information, please contact us at research@the-numbers.com.
Synopsis
SOMEBODY UP THERE LIKES ME skips through 35 years in the life of Max Youngman, his best (and only) friend Sal, and the woman they both adore. As they stumble in and out of hilariously misguided relationships - strung together with animated vignettes. Max never ages, holding on to a mysterious briefcase that may or may not contain the secret to life.
Metrics
| Opening Weekend: | $34,362 (38.4% of total gross) |
| Legs: | 2.60 (domestic box office/biggest weekend) |
| Domestic Share: | 100.0% (domestic box office/worldwide) |
| Theater counts: | 1 opening theaters/3 max. theaters, 2.7 weeks average run per theater |
| Infl. Adj. Dom. BO | $131,572 |
Movie Details
| Domestic Releases: | March 8th, 2013 (Limited) by TriBeca Films |
| MPA Rating: | Not Rated |
| Running Time: | 76 minutes |
| Cast, crew, or production detail: | Animated Sequences |
| Plot point: | Love Triangle, Romance |
| Source: | Original Screenplay |
| Genre: | Comedy |
| Production Method: | Animation/Live Action |
| Creative Type: | Contemporary Fiction |
| Production/Financing Companies: | Faliro House Productions, M-13 Pictures |
| Production Countries: | United States |
| Languages: | English |
Weekend Box Office Performance
| Date | Rank | Gross | % Change | Theaters | Per Theater | Total Gross | Week |
|---|---|---|---|---|---|---|---|
| Mar 8, 2013 | 50 | $34,362 | 1 | $34,362 | $34,362 | 1 | |
| Mar 15, 2013 | 66 | $12,310 | -64% | 1 | $12,310 | $47,487 | 2 |
| Mar 22, 2013 | 82 | $6,424 | -48% | 2 | $3,212 | $57,726 | 3 |
| Mar 29, 2013 | 66 | $17,565 | +173% | 3 | $5,855 | $77,095 | 4 |
| Apr 5, 2013 | 81 | $5,498 | -69% | 1 | $5,498 | $83,796 | 5 |
Weekly Box Office Performance
| Date | Rank | Gross | % Change | Theaters | Per Theater | Total Gross | Week |
|---|---|---|---|---|---|---|---|
| Mar 8, 2013 | 59 | $35,177 | 1 | $35,177 | $35,177 | 1 | |
| Mar 15, 2013 | 69 | $16,125 | -54% | 1 | $16,125 | $51,302 | 2 |
| Mar 22, 2013 | 86 | $8,228 | -49% | 2 | $4,114 | $59,530 | 3 |
| Mar 29, 2013 | 72 | $18,768 | +128% | 3 | $6,256 | $78,298 | 4 |
| Apr 5, 2013 | 89 | $6,700 | -64% | 1 | $6,700 | $84,998 | 5 |
| Apr 12, 2013 | 96 | $2,090 | -69% | 2 | $1,045 | $86,043 | 6 |
| May 10, 2013 | 109 | $1,540 | 1 | $1,540 | $87,583 | 10 | |
| May 31, 2013 | 84 | $1,049 | 2 | $525 | $88,632 | 13 | |
| Oct 11, 2013 | 108 | $803 | 1 | $803 | $89,435 | 32 |
Full financial estimates for this film, including domestic and international box office, video sales, video rentals, TV and ancillary revenue are available through our research services. For more information, please contact us at research@the-numbers.com.